document_targets() writes tardoc/viewer.html: one self-contained file that
opens in any browser with no server and no R. All pipeline content is inlined;
the rendering libraries — marked, fuse.js, and React with React Flow for the
graph — load from jsDelivr and cdnjs at pinned versions with subresource
integrity, so the page needs network access the first time it is opened and comes
from the browser cache afterwards.
tardoc::document_targets(pkg_name = "My pipeline")
tardoc::view_tardoc()
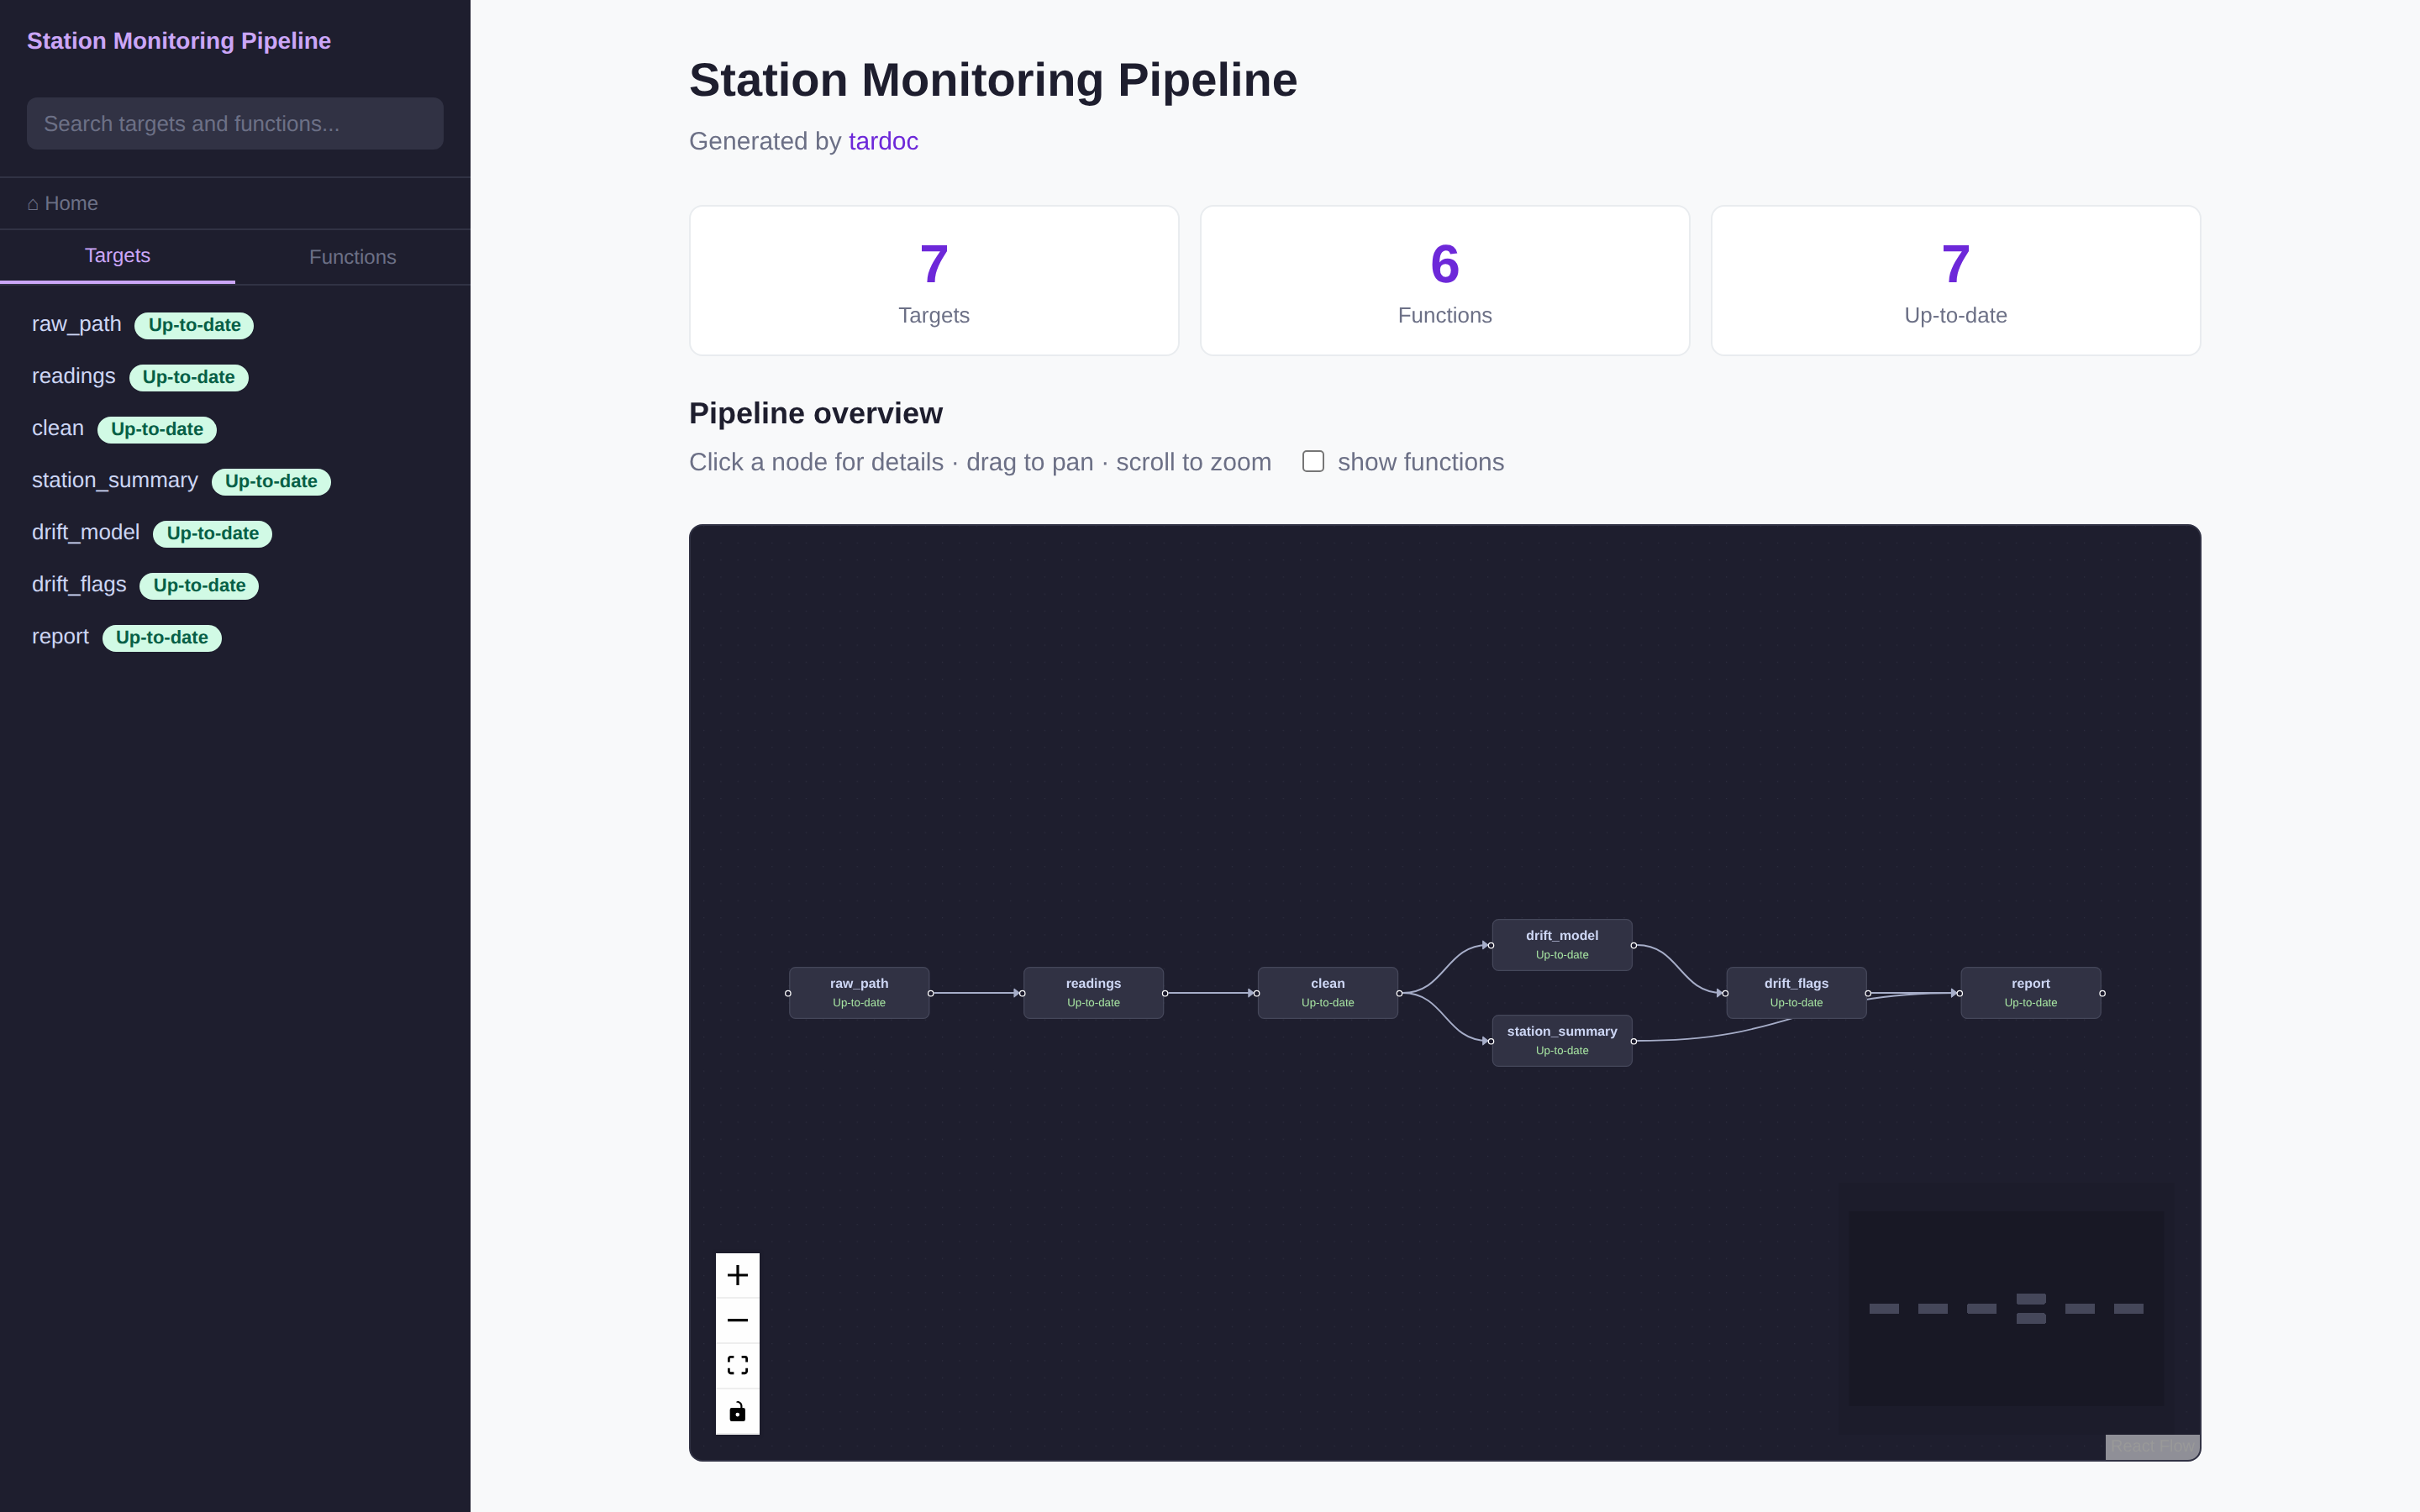
Everything below was generated from the runnable example pipeline in
inst/examples/station-monitoring — nothing is hand-written. The
live demo is that pipeline, rebuilt on every push.
1 An overview in your own words
The home page opens with whatever you write in tardoc/notes/index.md —
what the pipeline is for, who owns it, what a newcomer should read first —
above the status counts. It is created as an empty stub on the first run and
never overwritten, like every other note. While it is empty the home page is
exactly as it was.
2 The pipeline graph
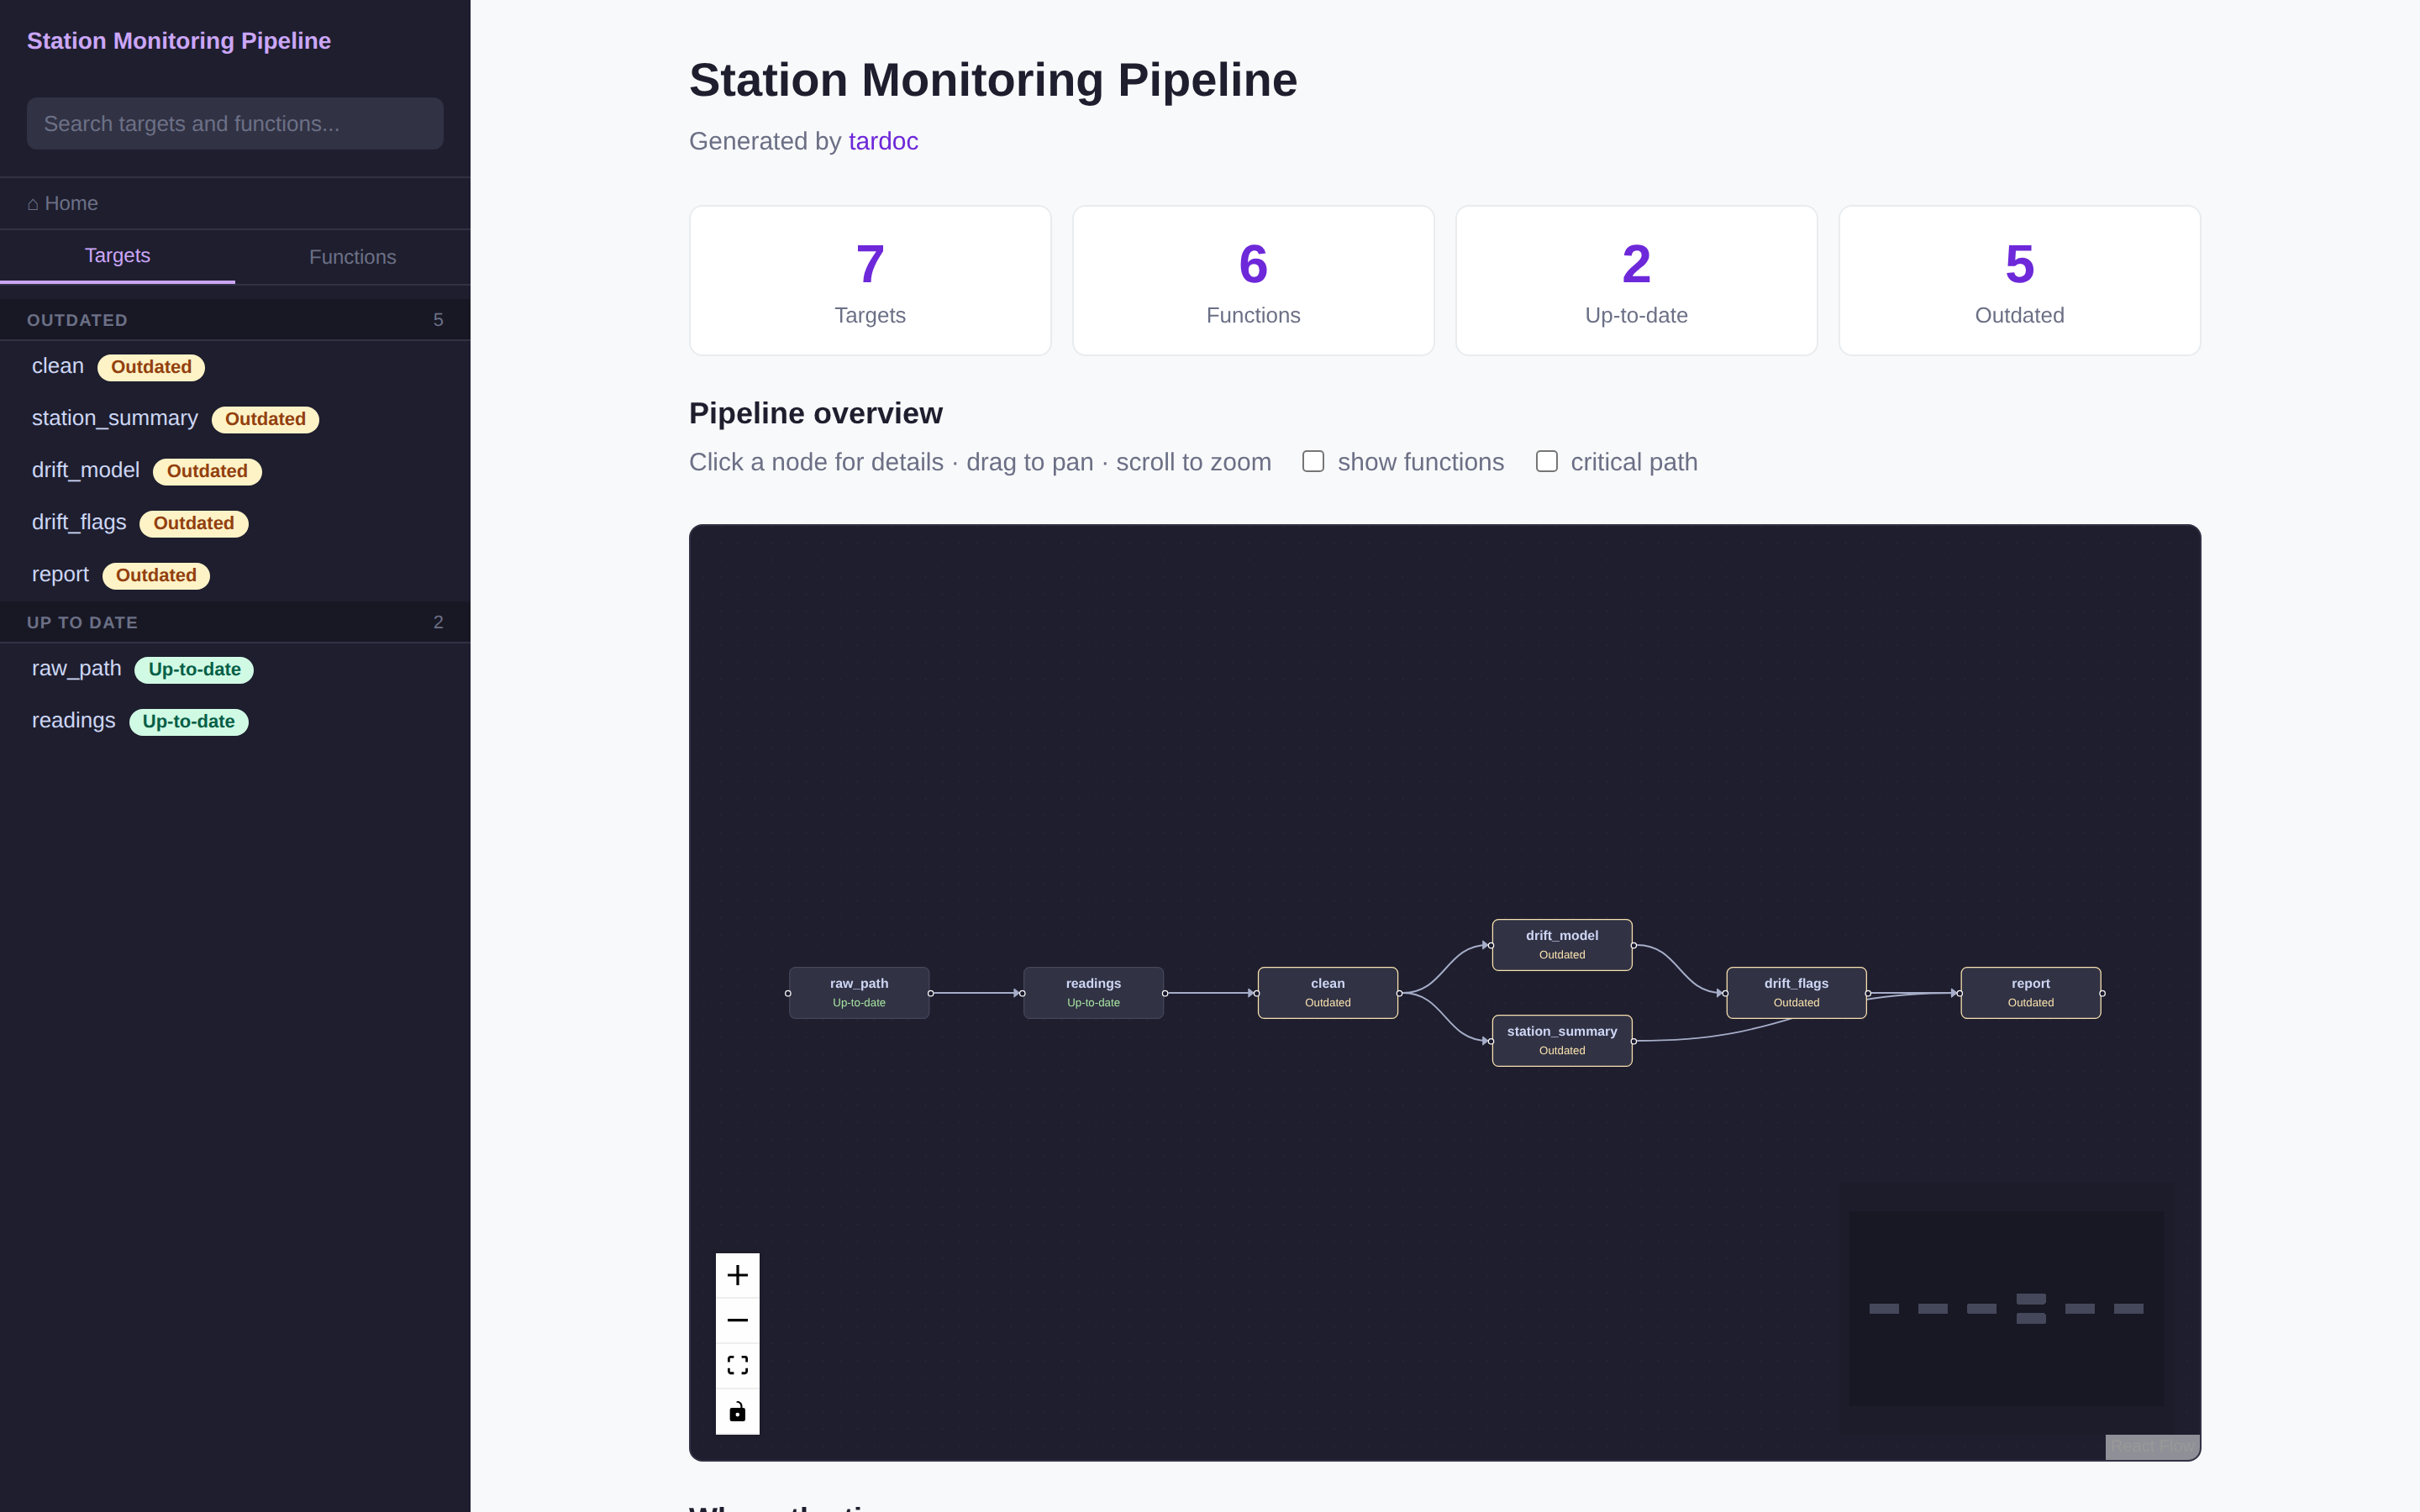
The home page opens on the whole pipeline: drag to pan, scroll to zoom, a minimap, and a show functions toggle that adds the functions each target calls as dashed nodes.
Clicking a node opens an inspect panel rather than navigating away.
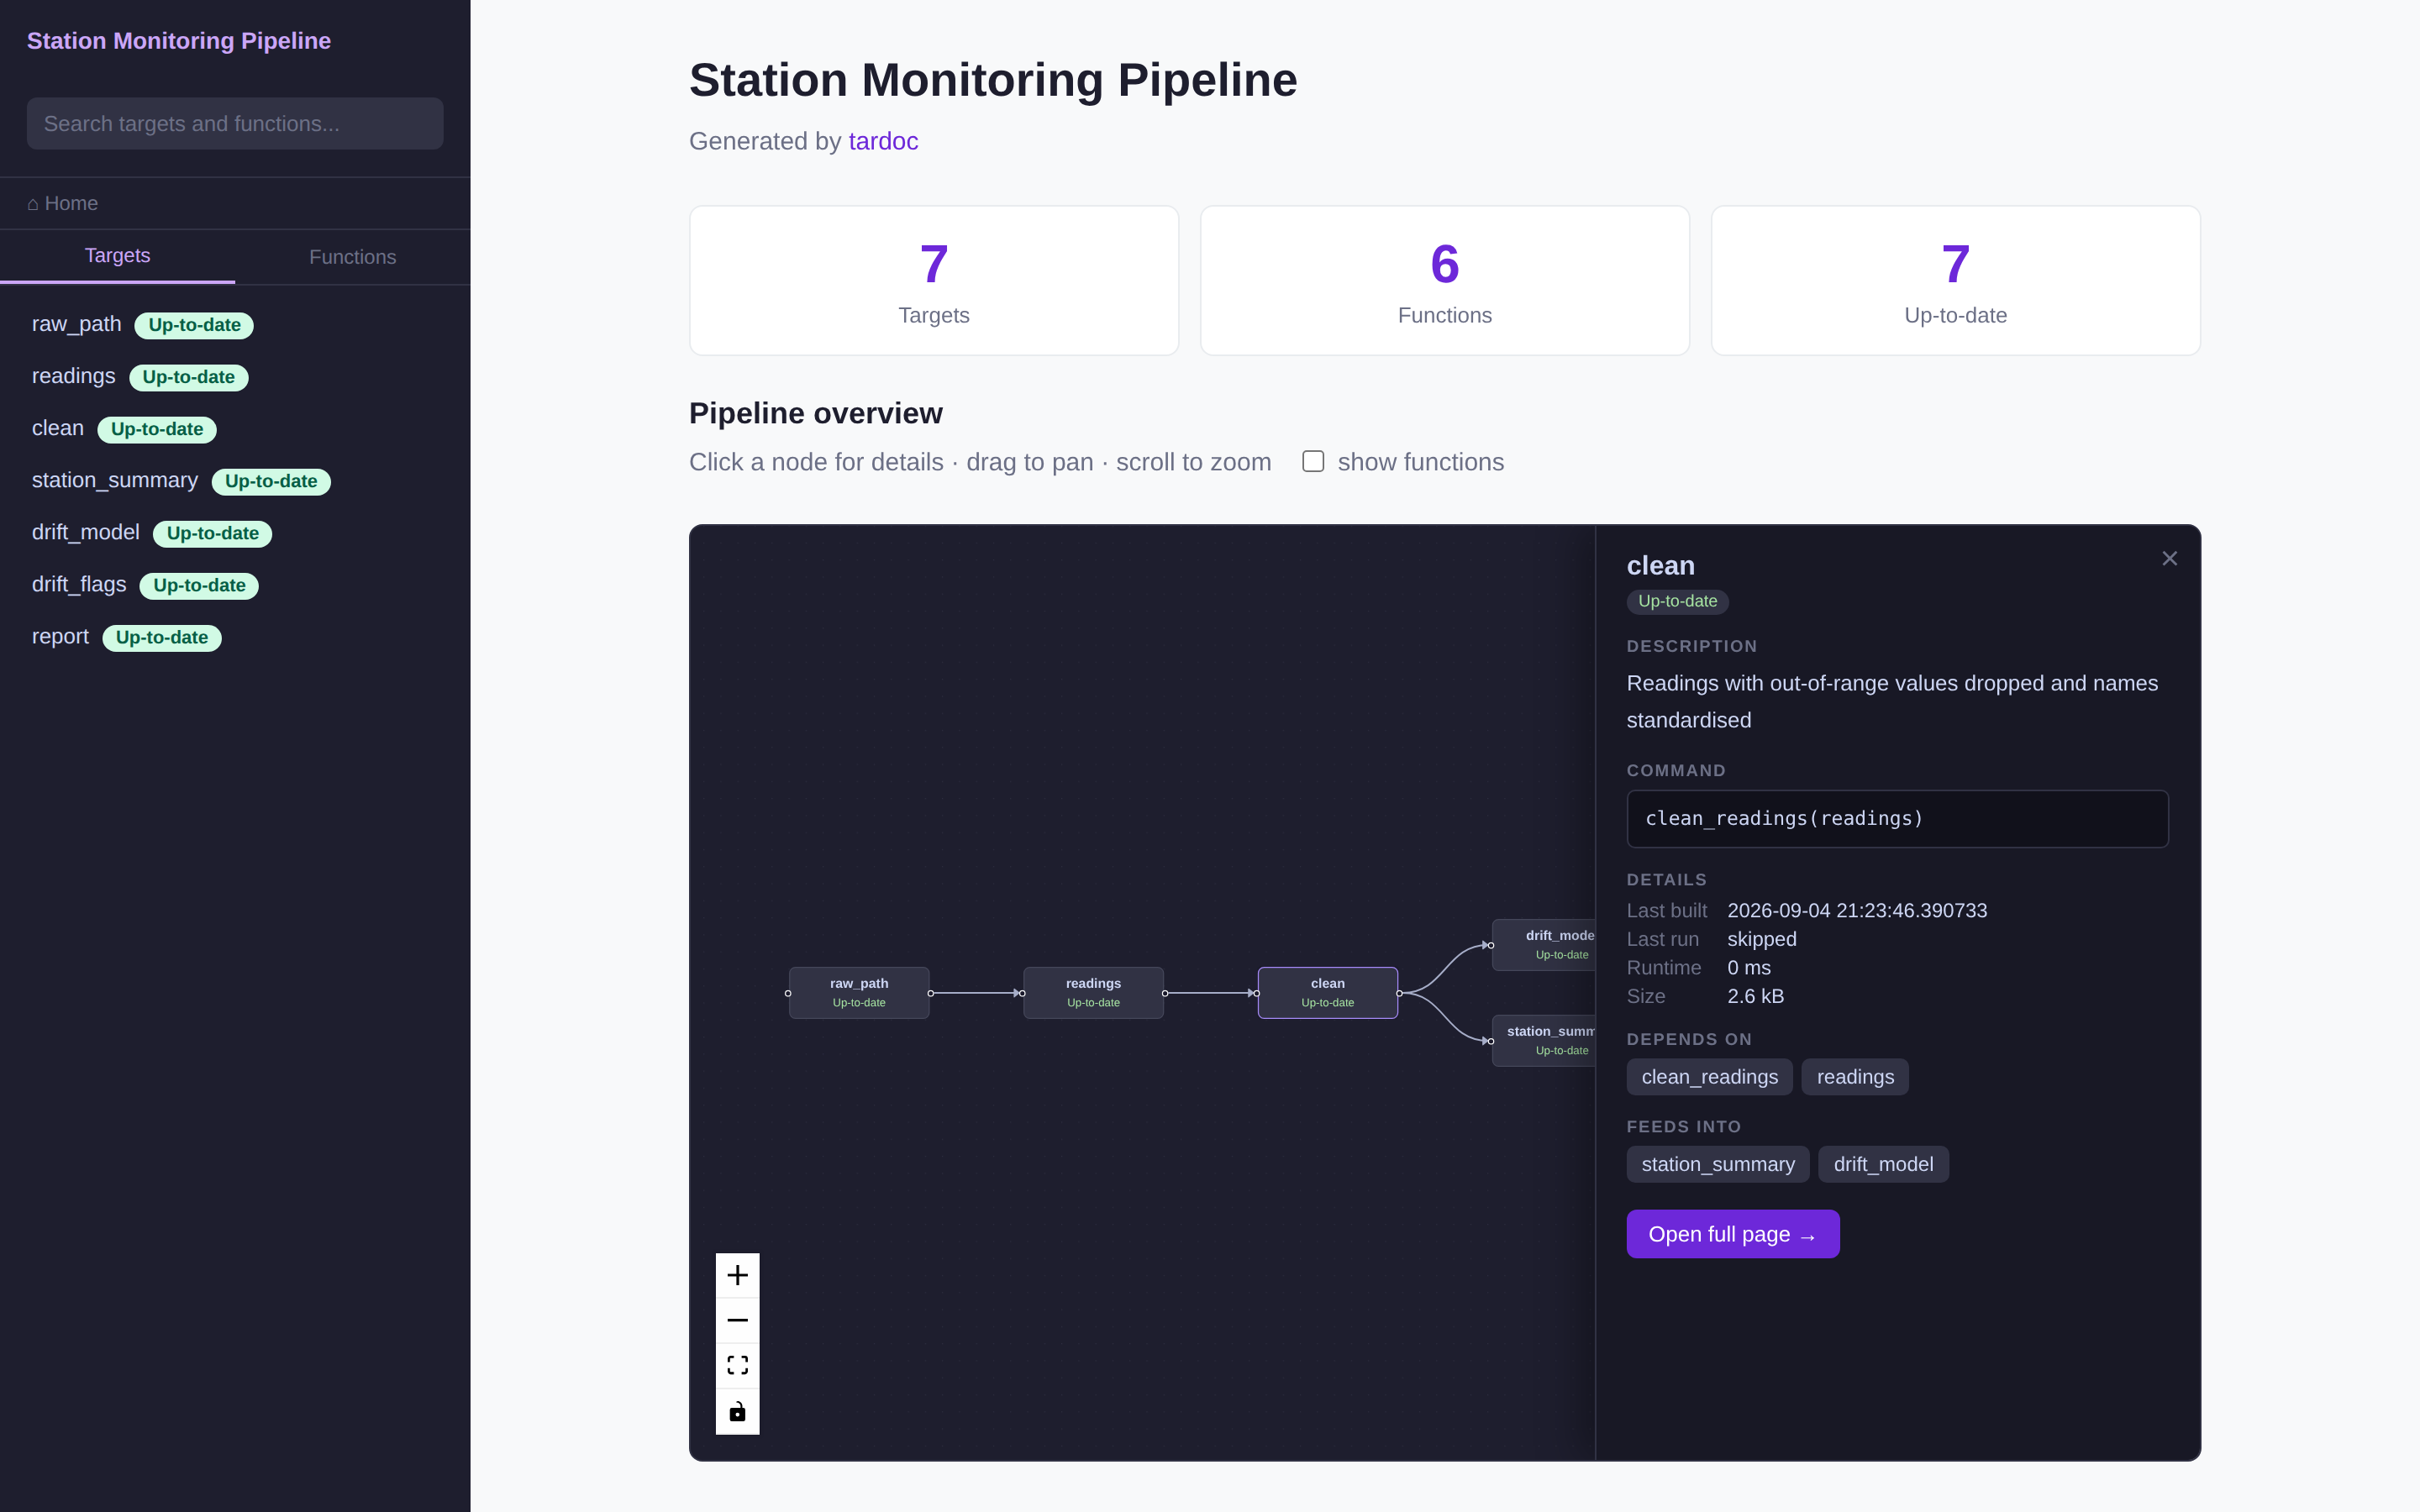
The panel shows the target’s description and command, its branching pattern
when it is a dynamic target, any error or warnings, build details (format,
repository, iteration, last built, runtime, size), and its neighbours as
clickable chips. Open full page → navigates the viewer to that target.
The graph is React Flow, not mermaid — the
design note has the reasoning, what a node
exposes, and where the branching fields come from. The generated .md files
still carry a mermaid fence so they render on GitHub and anywhere else markdown
is read; the viewer replaces that fence with a live graph built from the same
data.
2.1 Follow a chain
Clicking a node also fades everything outside its neighbourhood, so what does this feed, and what feeds it? is answered at a glance rather than by tracing edges. A bar above the graph sets the direction (upstream, downstream or both) and the depth (1, 2, 3 or all), and counts what is lit. Clicking the empty canvas, or clear focus, puts the graph back.
Traversal is directional — upstream follows edges backwards only — so a helper function shared by a dozen targets does not drag the other eleven into the neighbourhood. Functions are counted only while show functions is on.
2.2 Filter the graph
The box above the graph filters it with selectors in the style of dbt’s
--select: clean+ is a target and everything downstream, +report is
everything upstream, 2+report limits the depth, ingest_* is a wildcard,
a,b intersects and -name removes. clean+ -report is “what clean feeds,
except the report”.
The selector guide has the full grammar, recipes, and how it differs from dbt.
3 Freshness, not just errors
Every target is classified Up-to-date, Outdated, Errored or Not built.
Outdated comes from
tar_outdated():
a target whose command, dependencies or upstream targets changed since it was
built, even though it never errored.
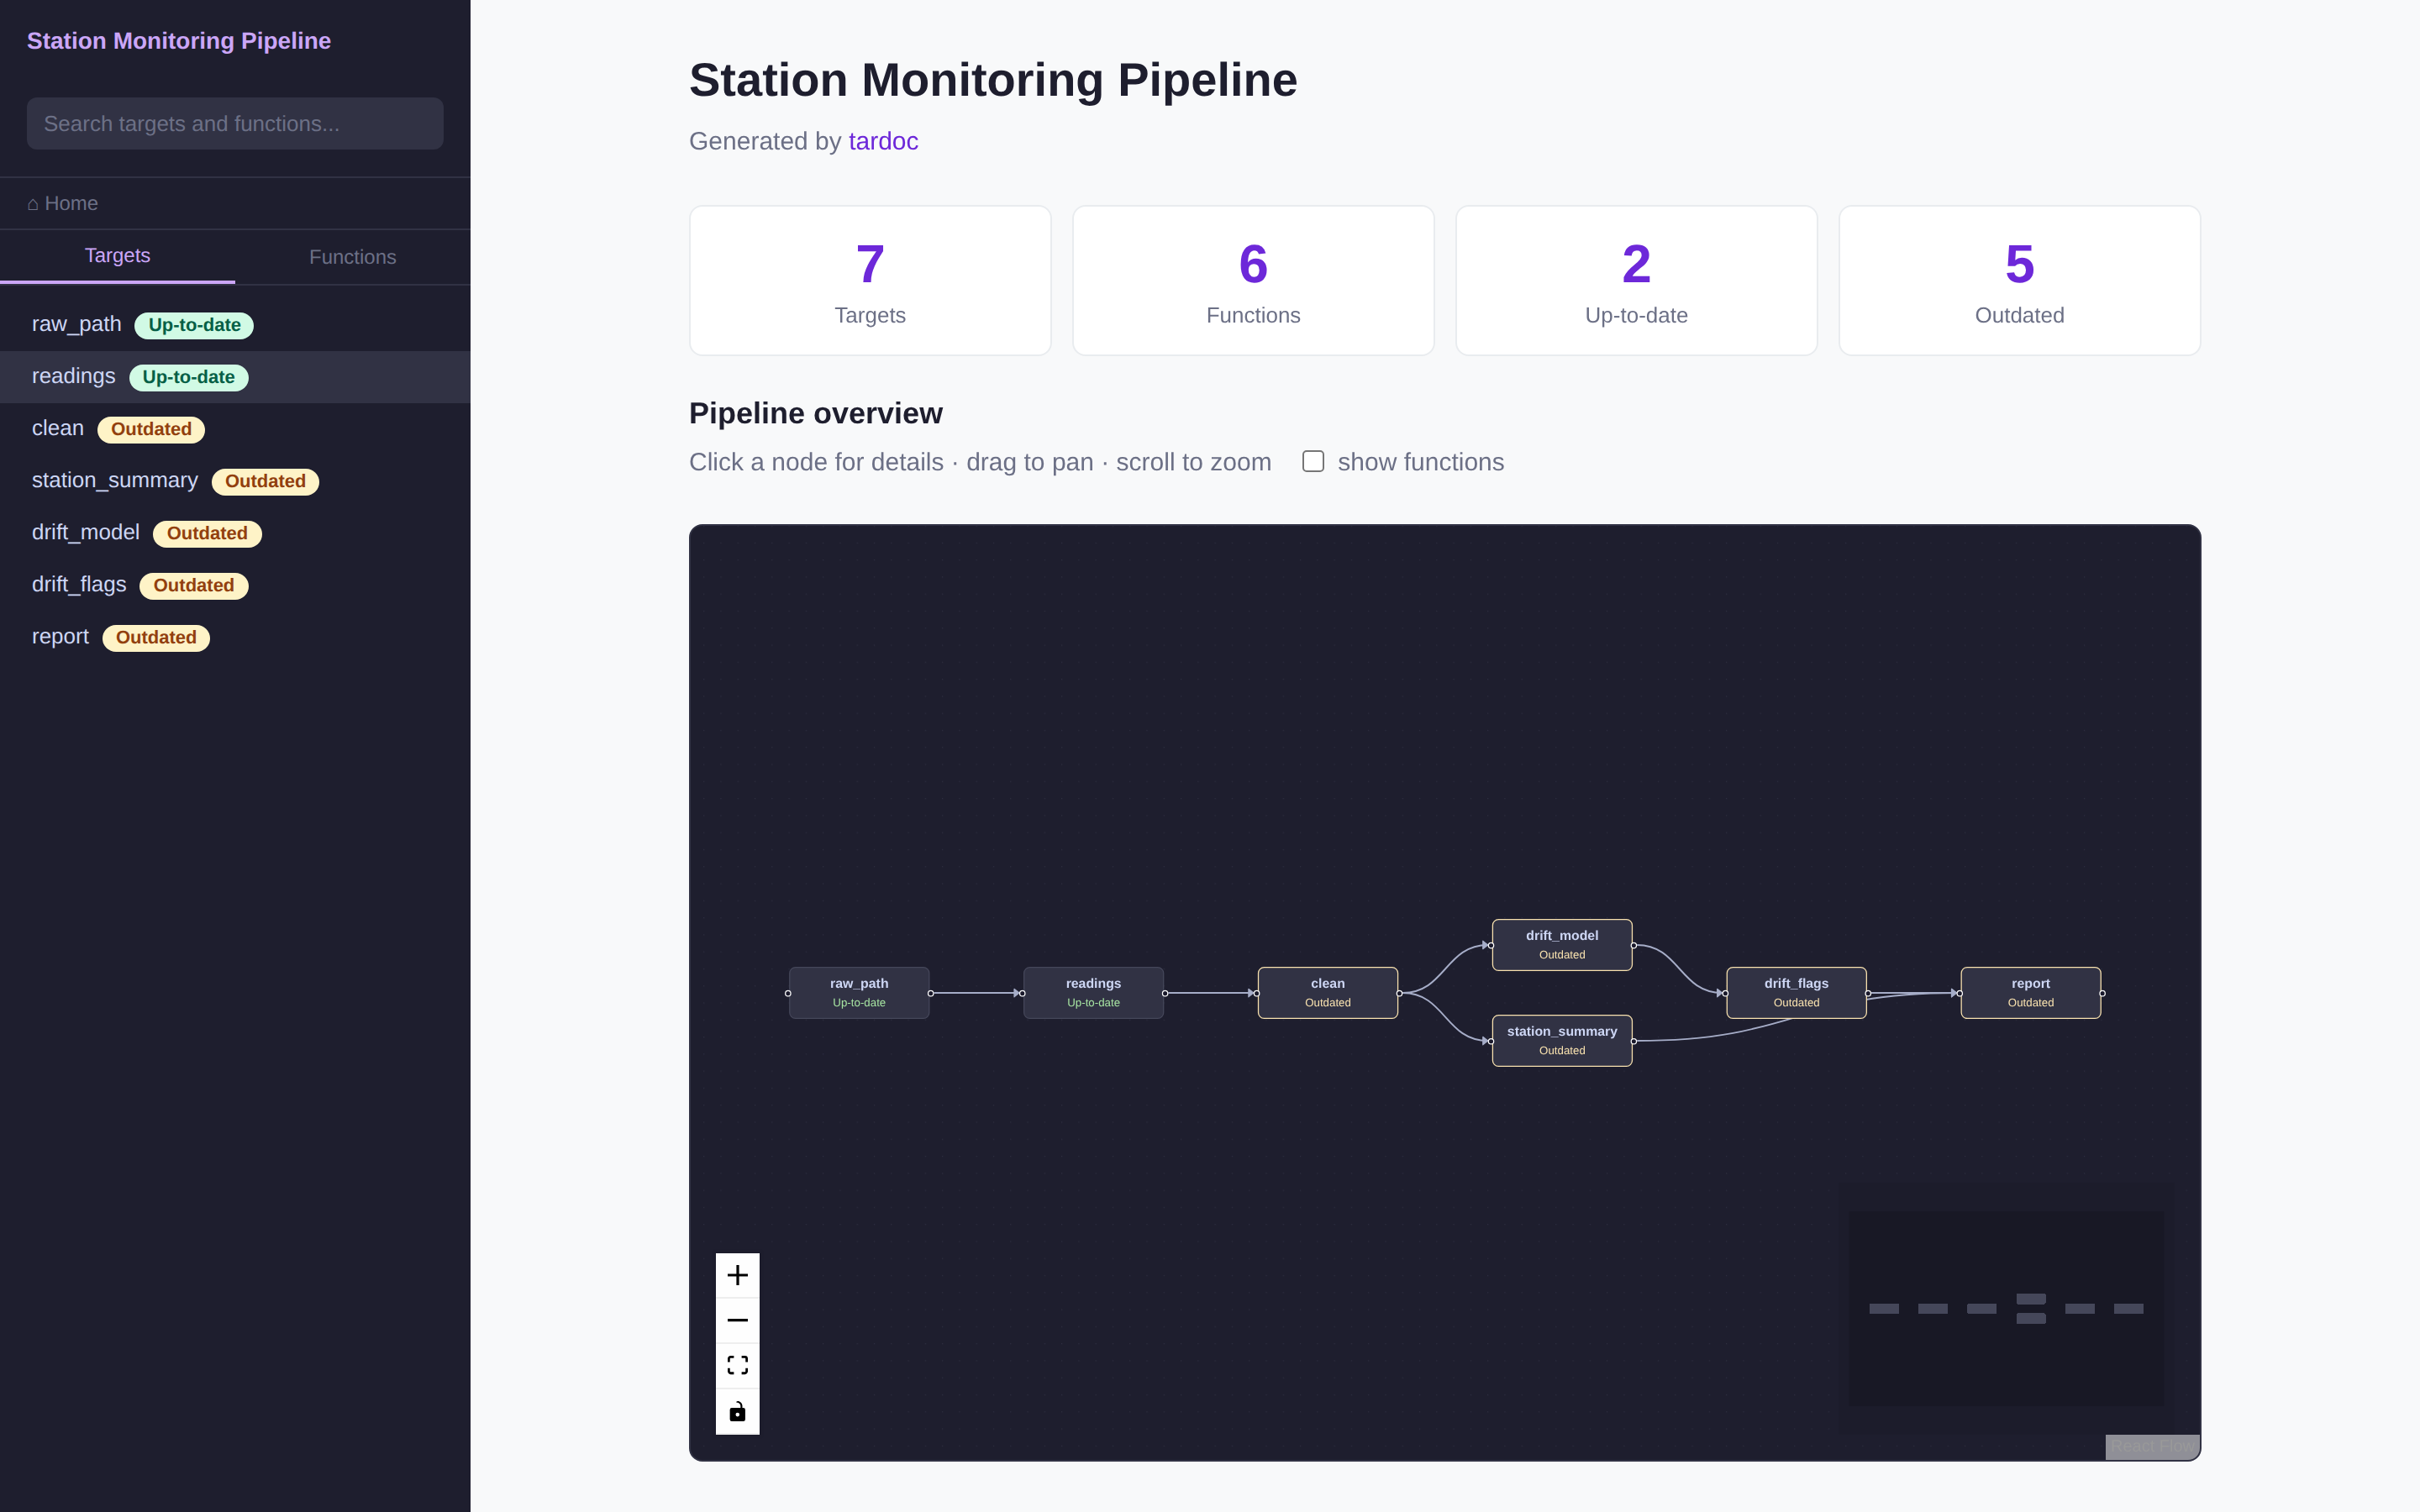
Staleness propagates. Editing one function marked clean and everything
downstream of it outdated, while raw_path and readings stayed current — the
distinction an error-only status cannot draw.
4 Target pages
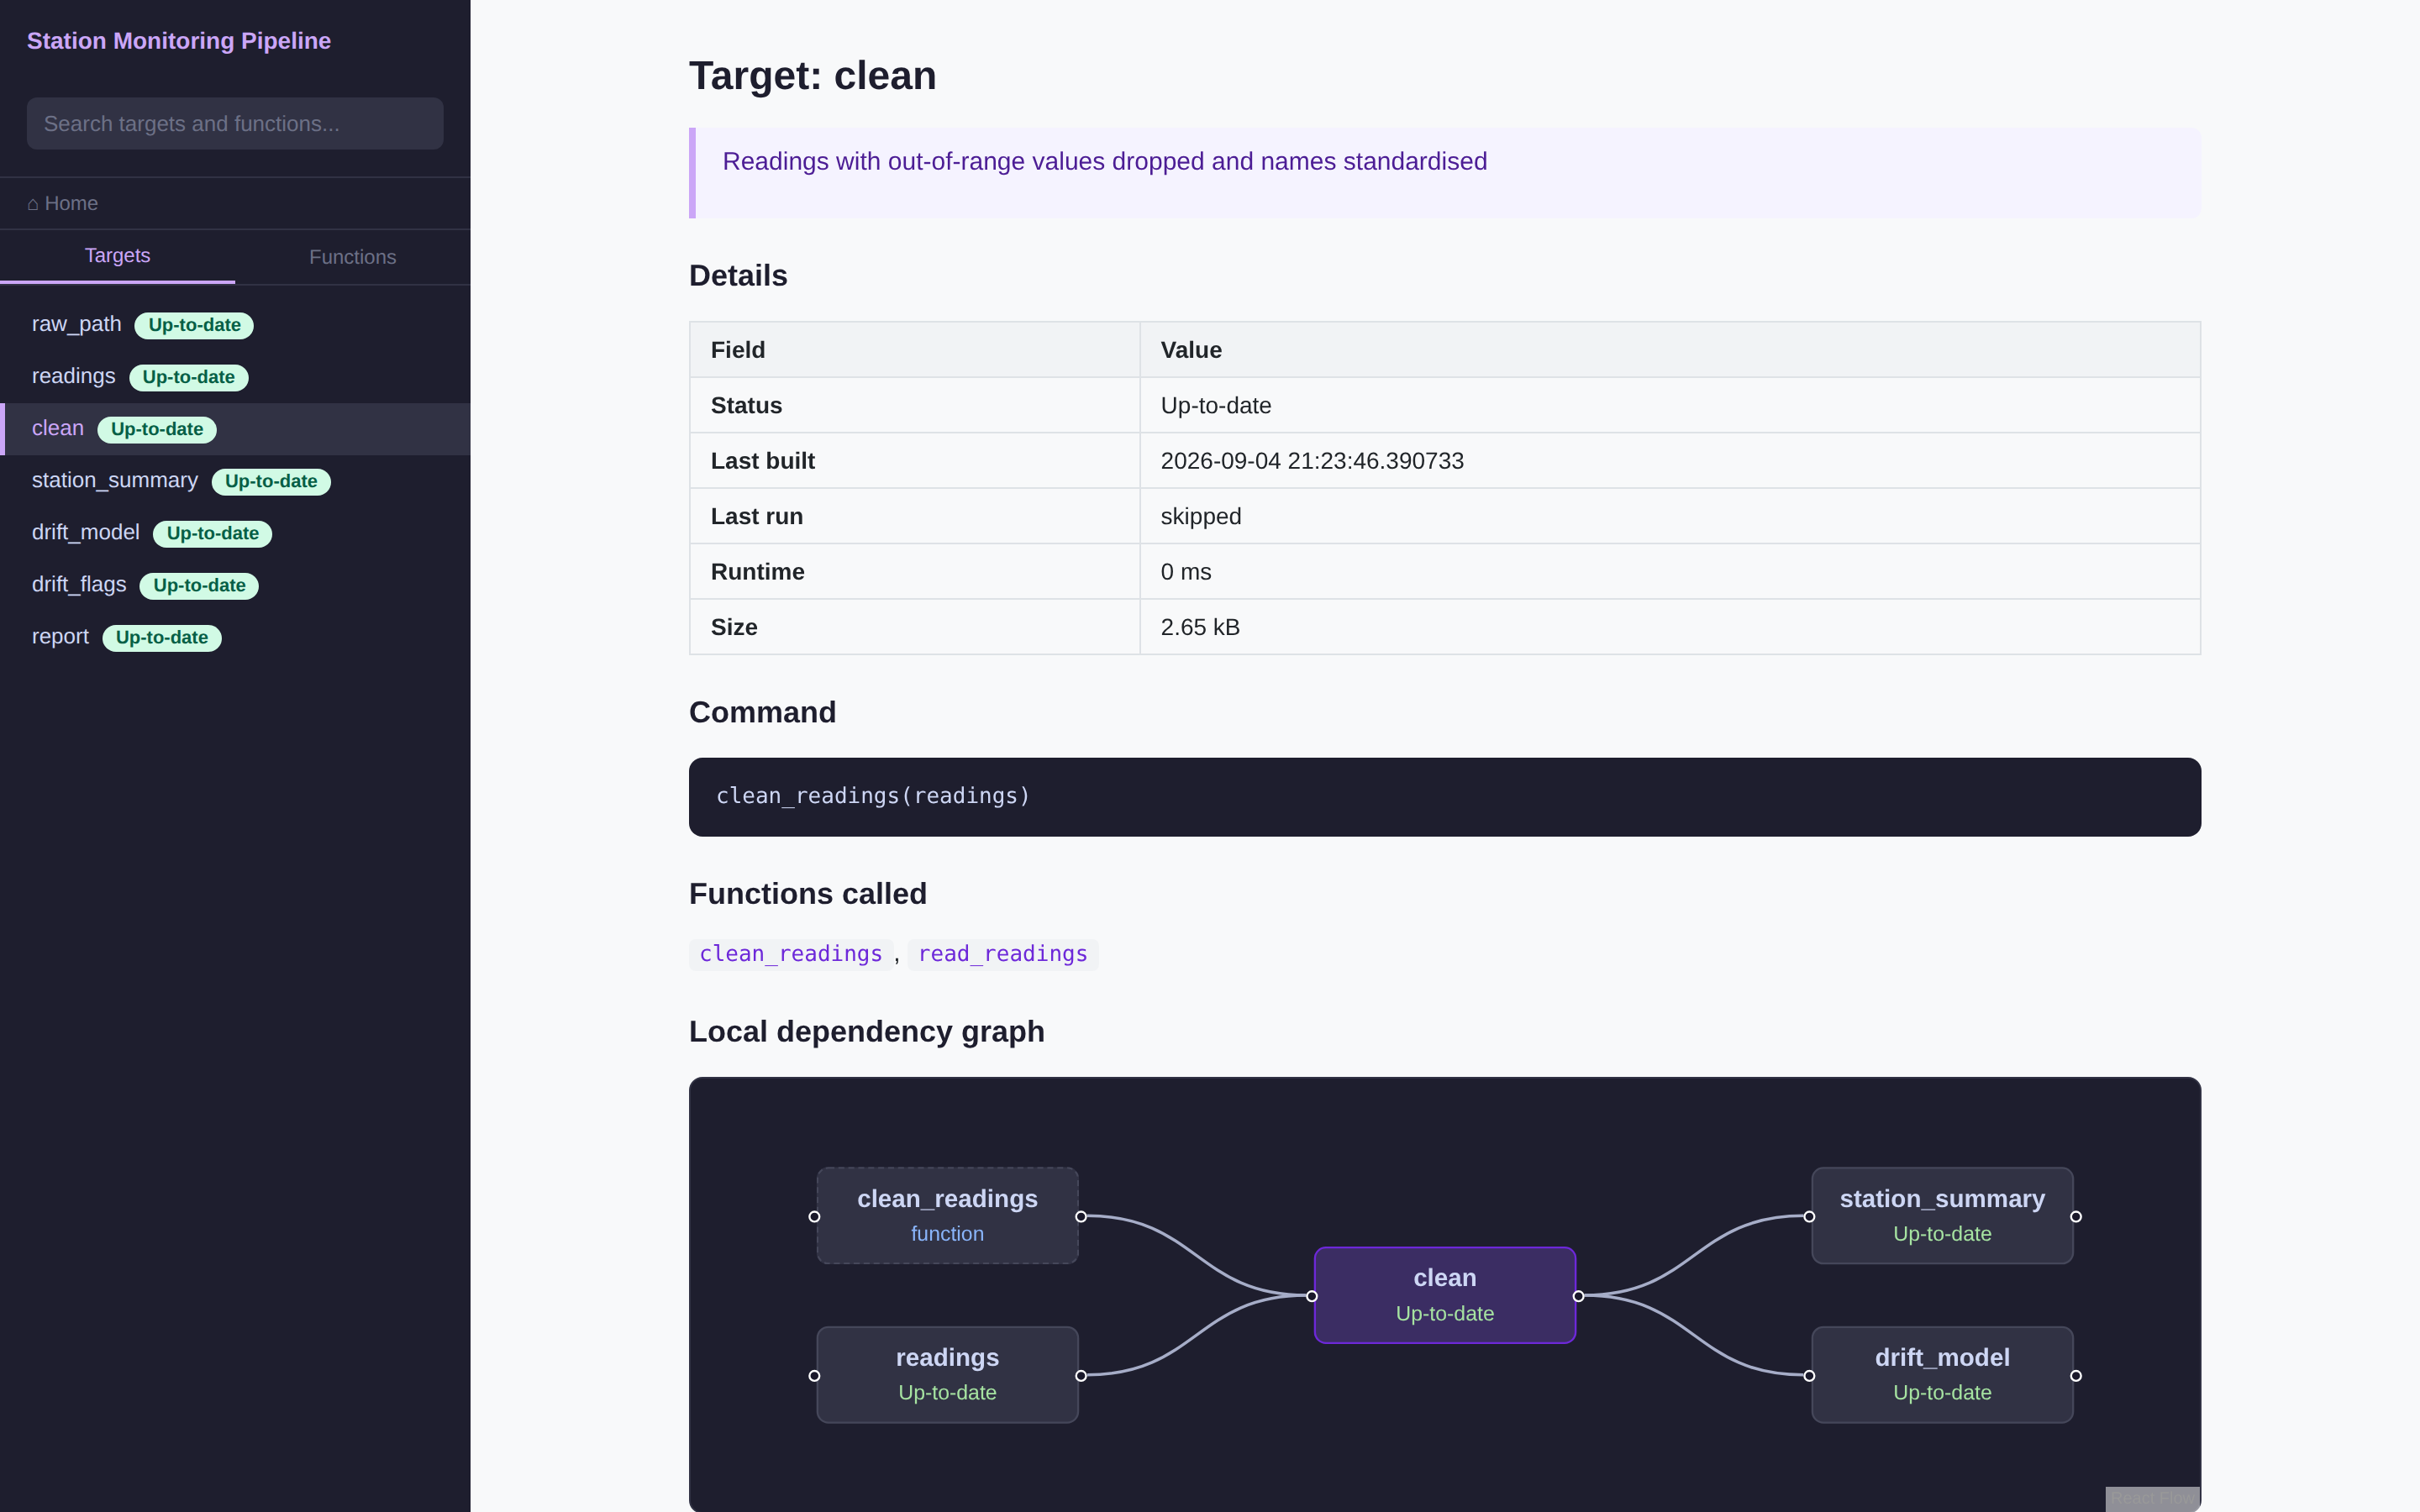
Per target: status, last built, what it did on the last run, branching pattern,
runtime, size, errors, warnings, the R command, the functions it calls, and a
local dependency graph centred on that target with its immediate upstream and
downstream neighbours. Functions appear with a dashed border and a function
label; clicking any neighbour navigates to it.
A dynamic target additionally lists each branch with its own runtime, size and error. Failed branches are always listed, however many branches there are.
Deep links work: viewer.html#targets:clean opens that page directly, and
selecting a page updates the hash.
4.1 What is missing
A Described card on the home page counts the targets with a description.
When any are missing, or any function has no roxygen block, the card opens a
list of them, each a link to its page. What counts is what the reader sees: a
description from description = in _targets.R, or one written by
llm = TRUE.
4.2 Build history
A target page ends with its own history once it has been built twice: runtime
and size across its real builds, drawn as small trend lines you can hover for
the build time. A target that was not rebuilt between two documentation runs
adds no point, so the line shows builds rather than runs of the docs. It reads
the same tardoc/history.json as Since the last build, keeping the last 30
builds of each target.
5 Function pages
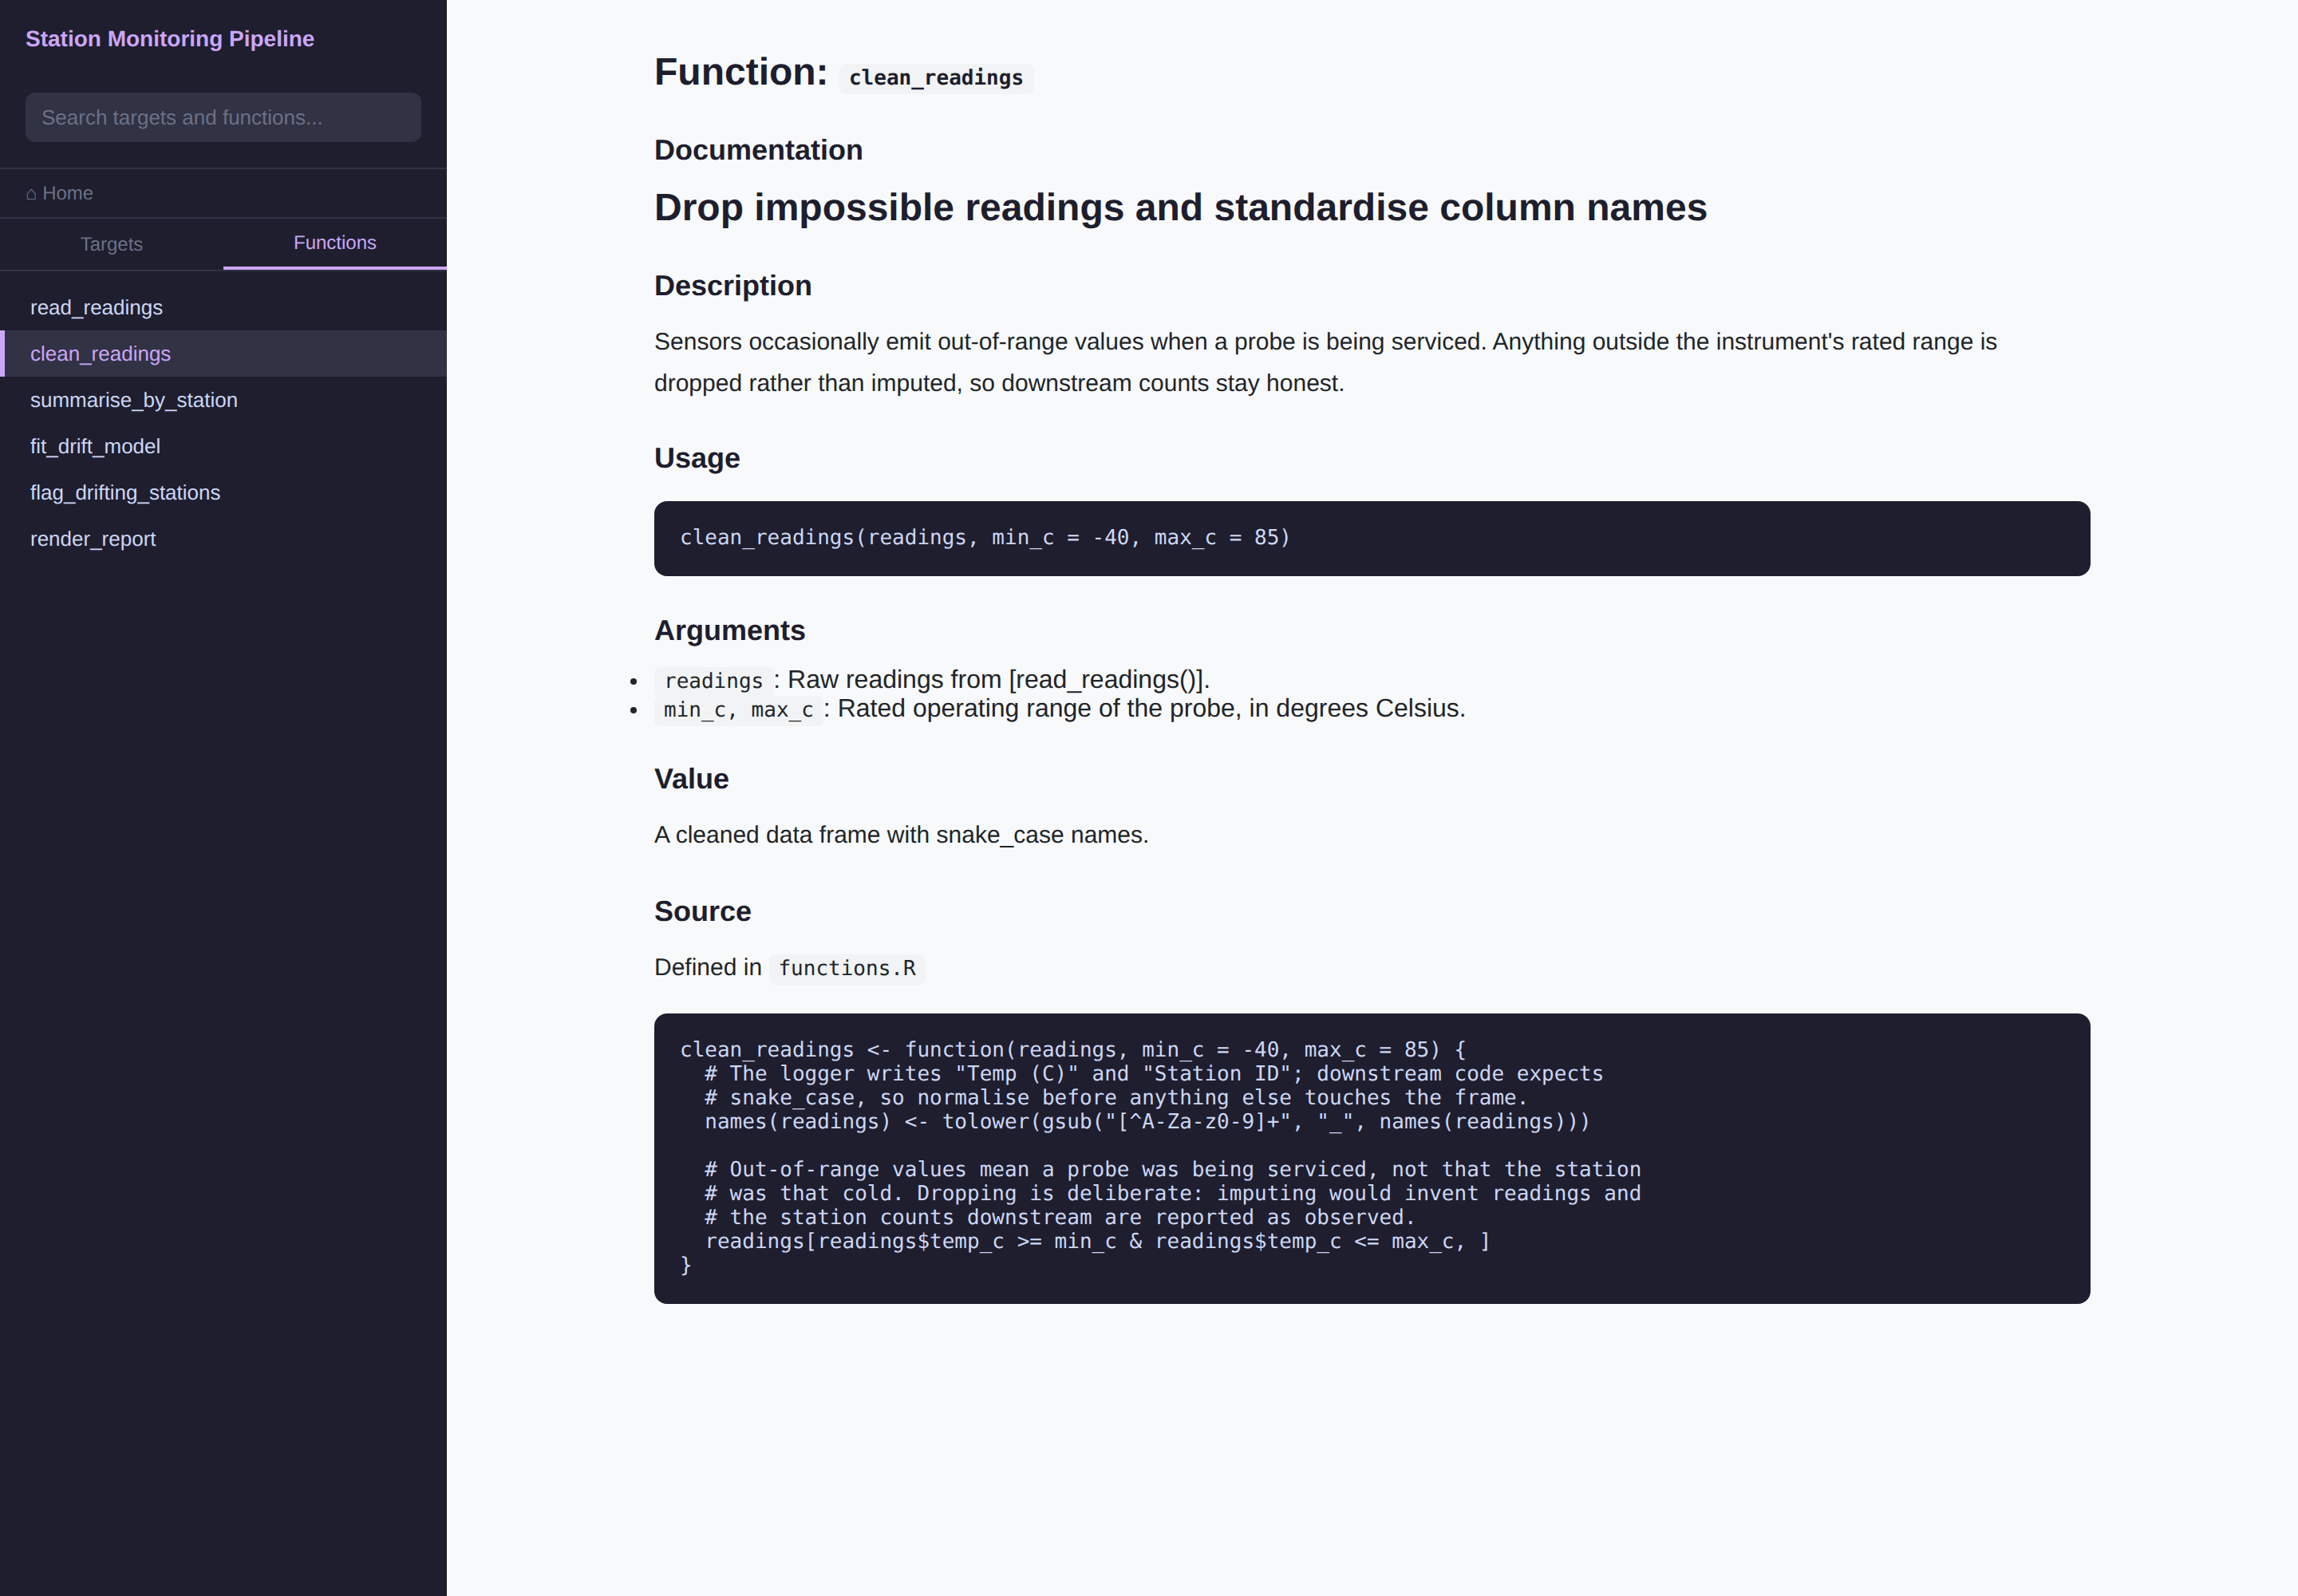
Roxygen is rendered to HTML — title, description, arguments, return value — with
the verbatim source underneath: comments, blank lines and the author’s own
formatting intact. The source is read from the file by srcref rather than
reconstructed with deparse(), which discards every comment inside a function.
Code blocks over 40 lines are clamped with a Show all N lines control, and every block has an Expand pop-out for a full-screen read.
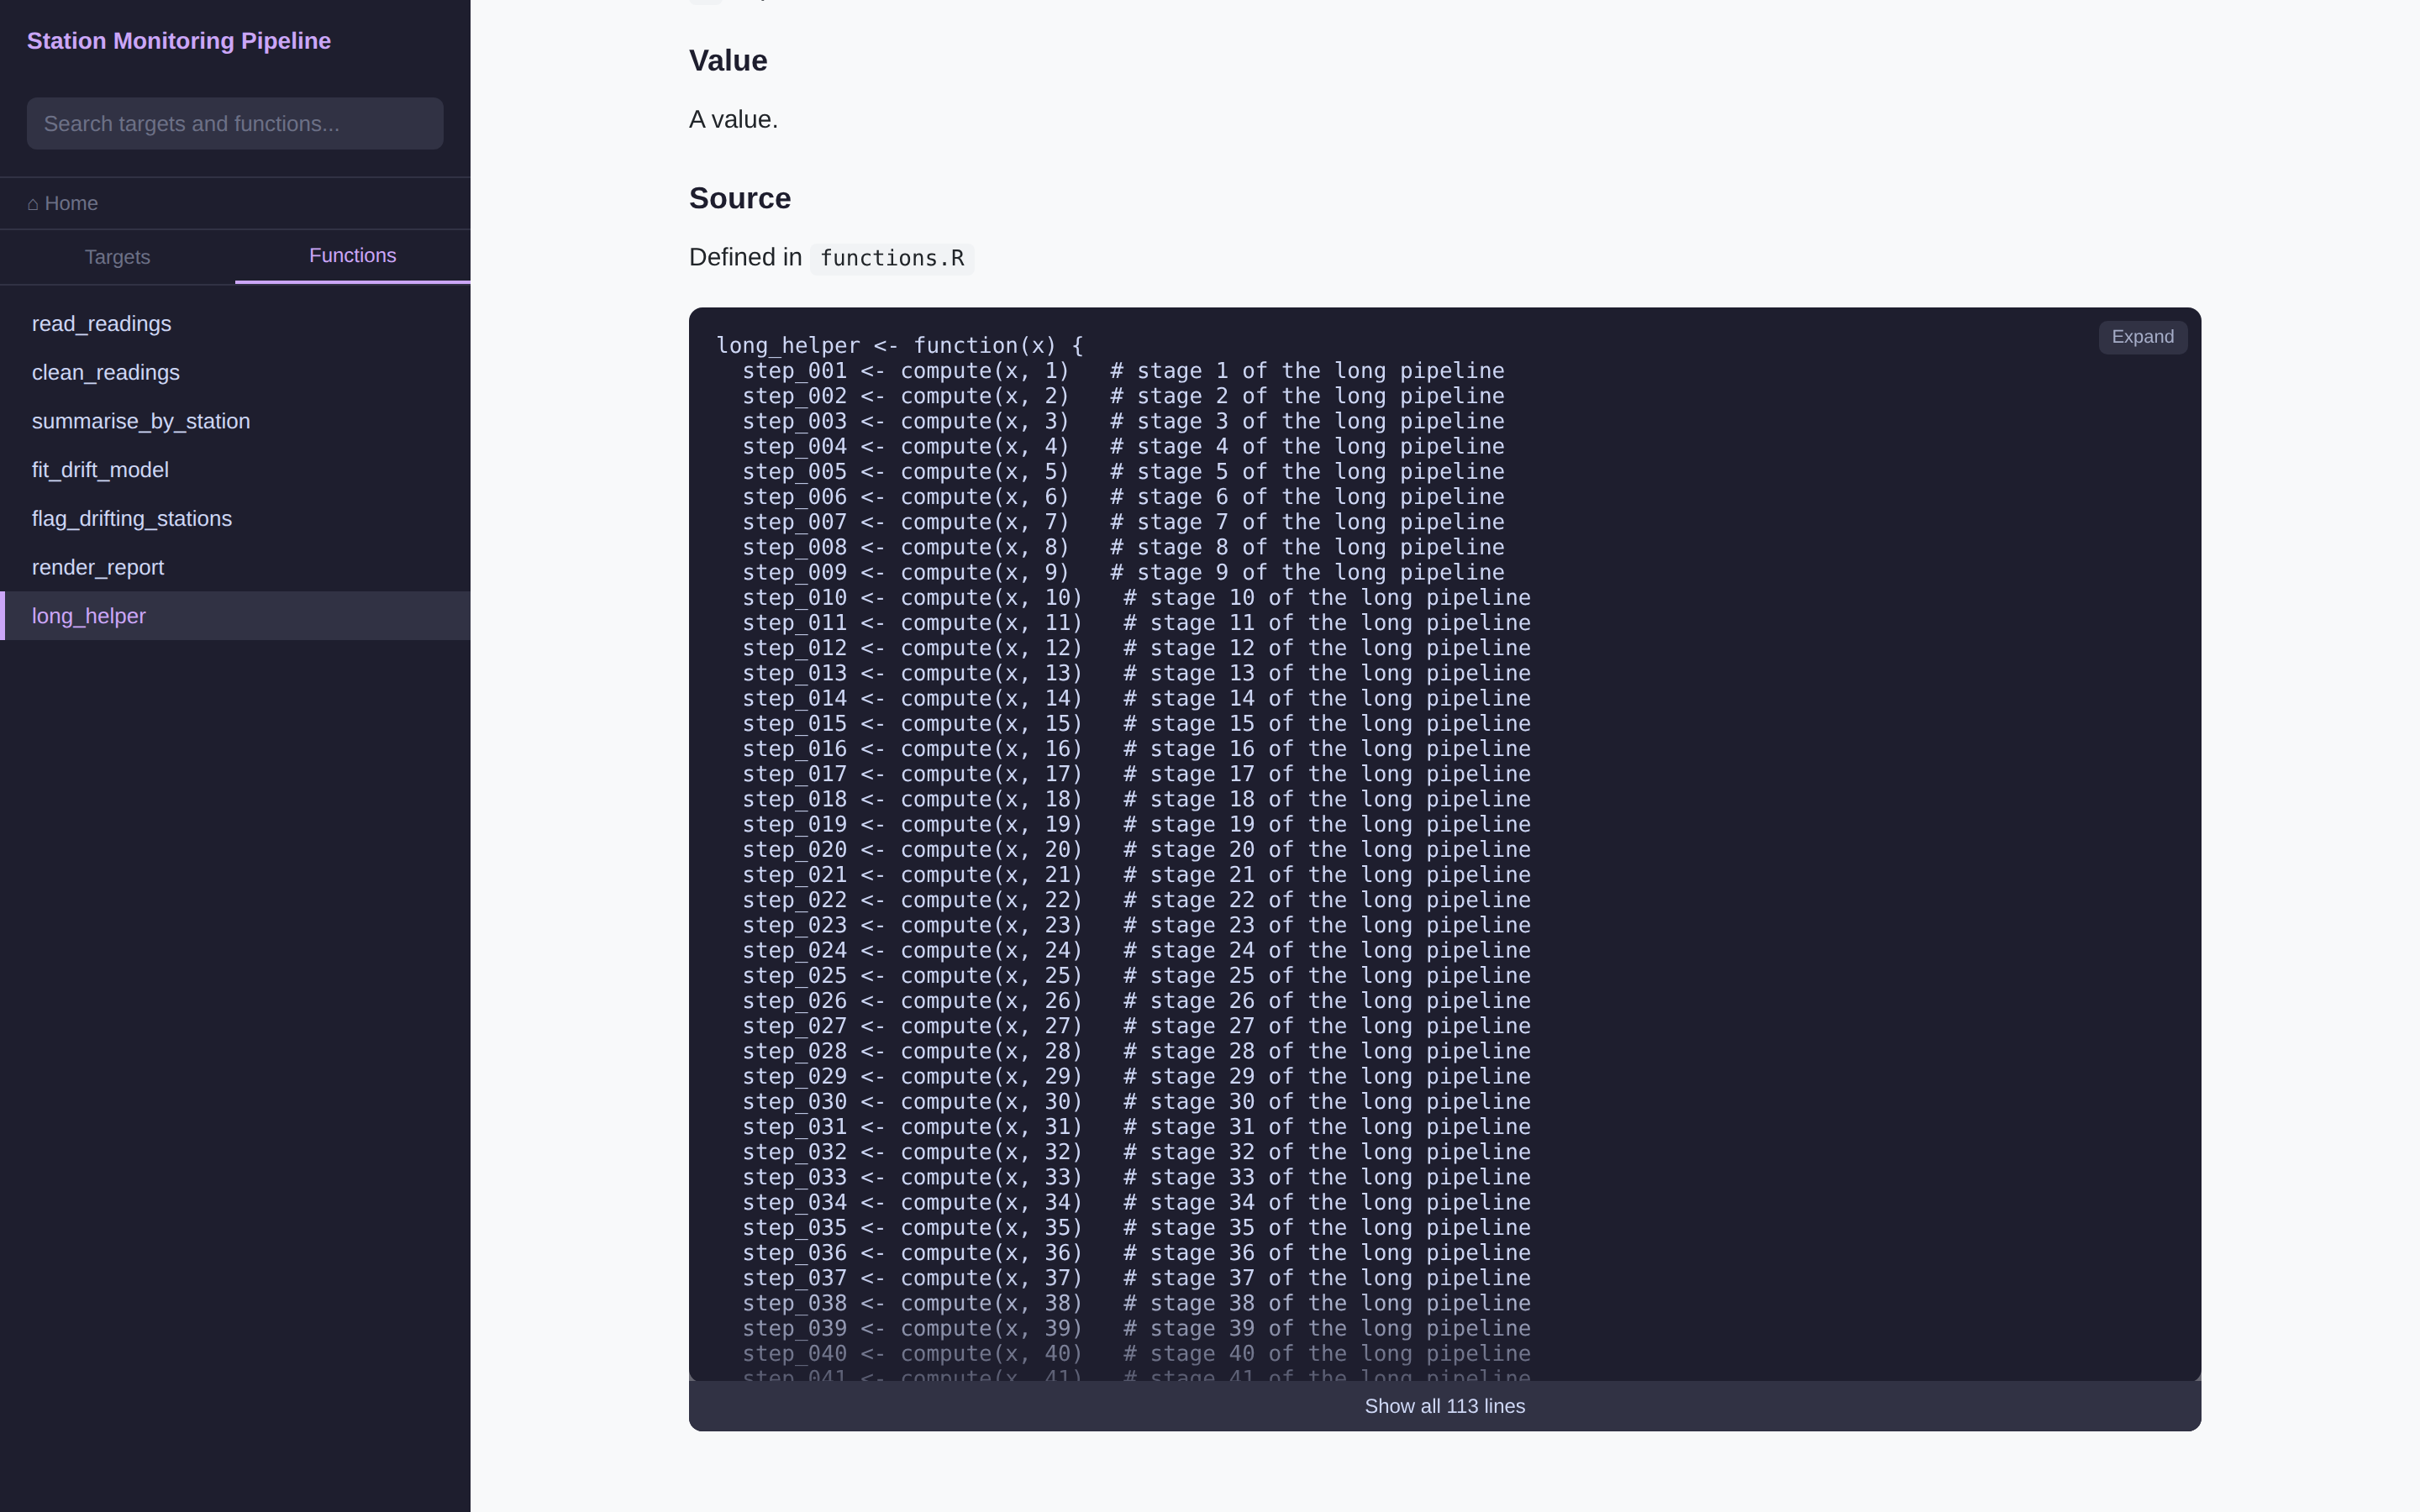
A 113-line function: clamped from 2.6 screens to 1.5, with the full text one click away and a pop-out for reading it at full width. Short blocks are left exactly as they are — the median function in real R code is about a dozen lines, and capping those would add a scrollbar to something that already fits.
6 Search
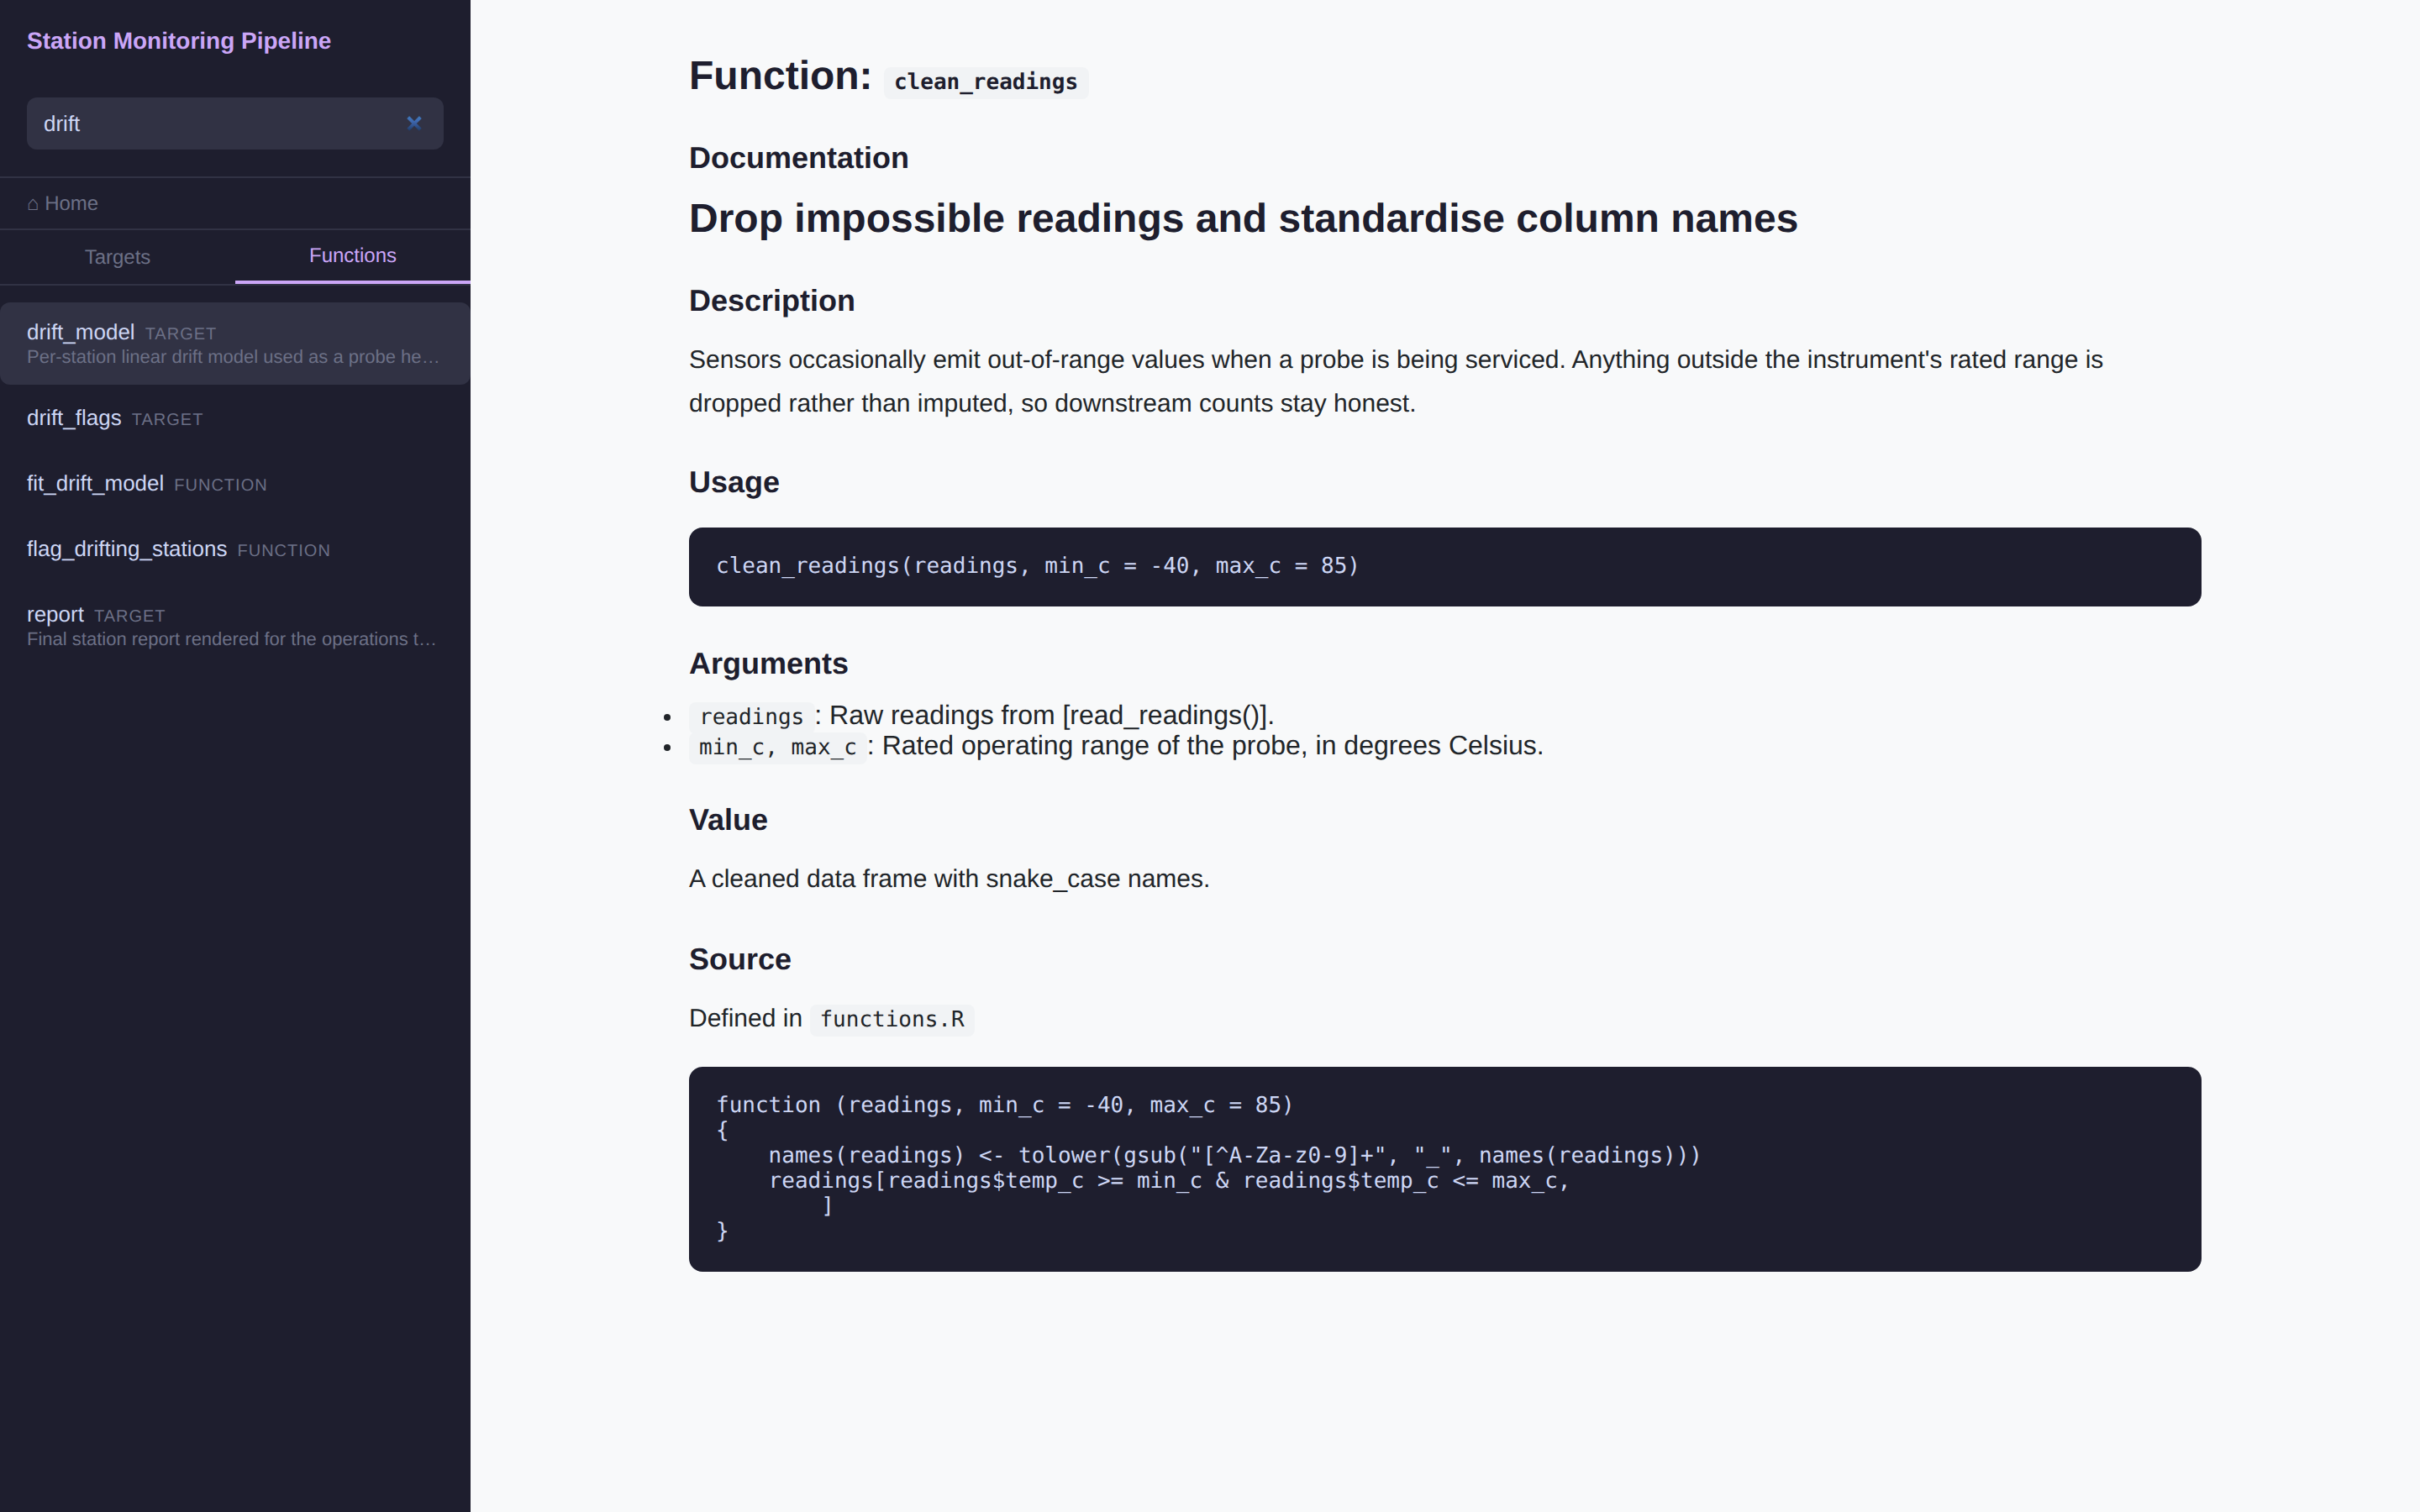
Fuse.js indexes names, descriptions and commands across targets and functions together, since you rarely know in advance whether what you want is a target or the function behind it. It is weighted toward names, so exact matches rank first.
7 Where the time goes
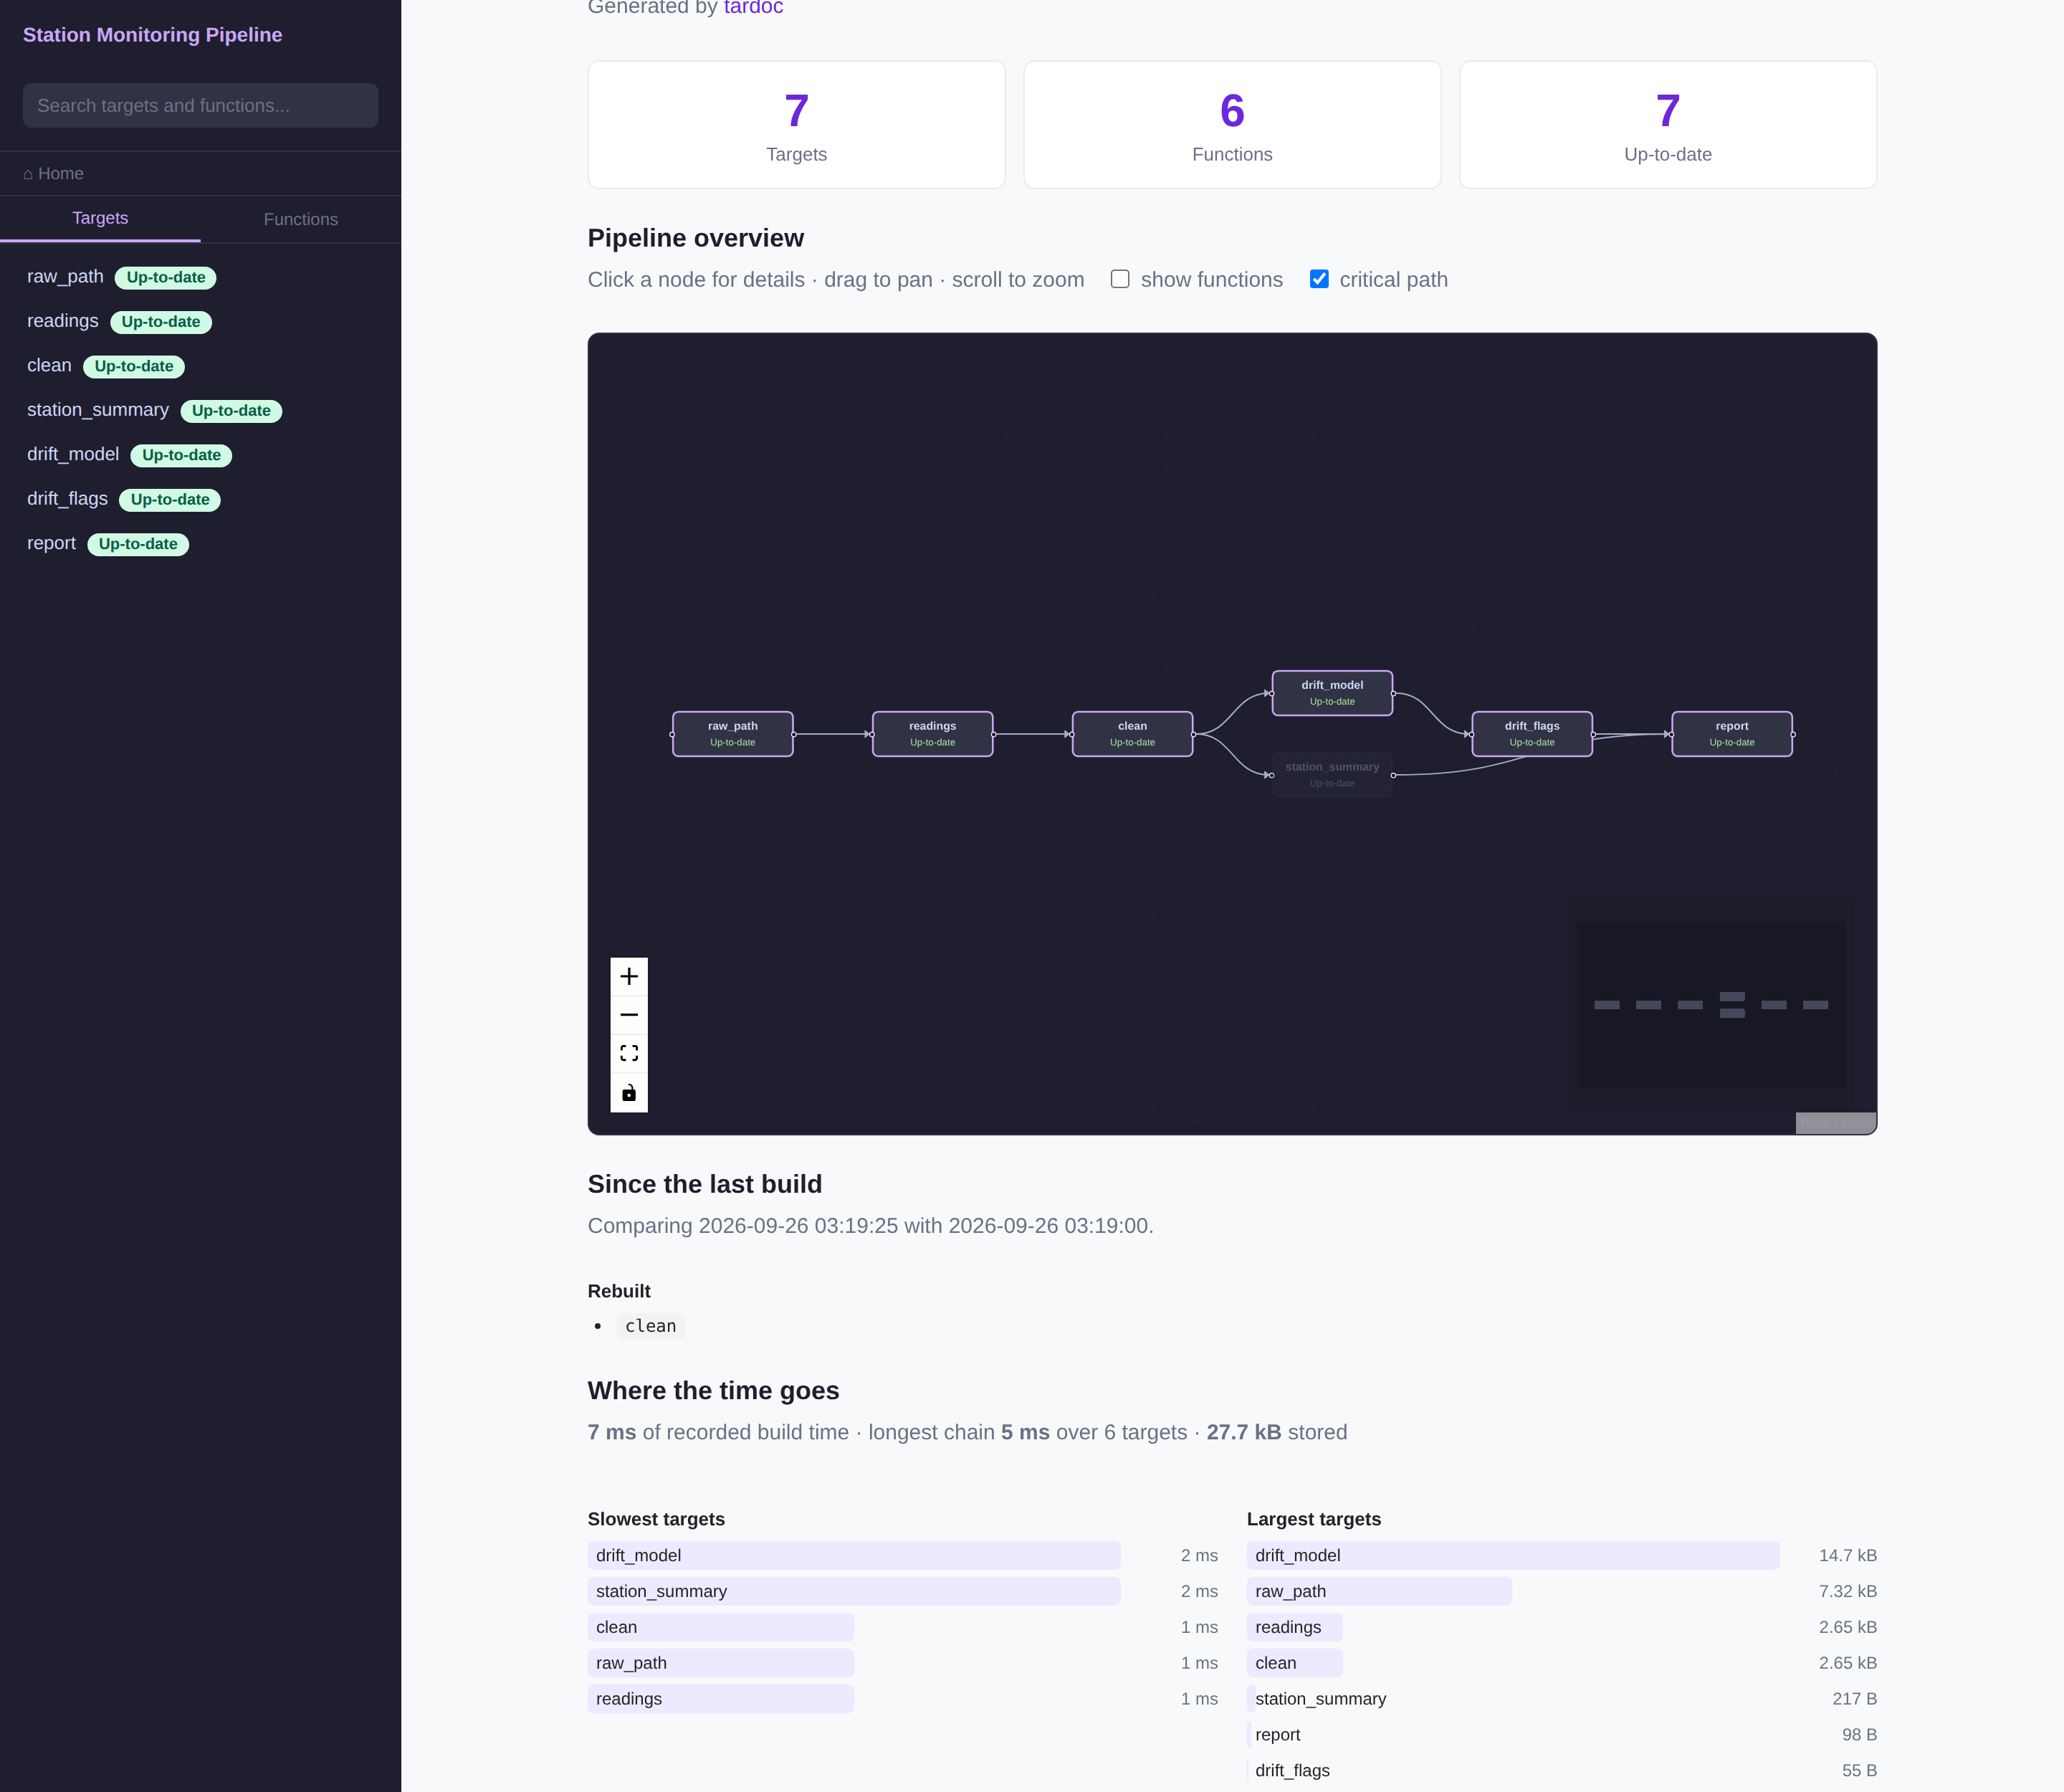
- The critical path — the longest dependency chain, whose total is the floor on a full rebuild however many workers you give it. Toggling it on the graph dims everything off that chain.
- Slowest and largest targets — every bar is a link to that target’s page.
- Since the last build — what rebuilt, what changed status, what got
meaningfully slower or larger. One snapshot per build is appended to
tardoc/history.json, and only when something differs from the previous build.
8 LLM-generated descriptions
# Auto-generate descriptions for undescribed targets and explain all functions
# Reads OPENAI_API_KEY env var by default
tardoc::document_targets(llm = TRUE)

# Ollama - local, free, no API key
tardoc::document_targets(llm = TRUE, llm_provider = "ollama", llm_model = "llama3.2")

# Anthropic
tardoc::document_targets(llm = TRUE, llm_provider = "anthropic")

# llama.cpp or any OpenAI-compatible server
tardoc::document_targets(
  llm          = TRUE,
  llm_provider = "openai_compatible",
  llm_base_url = "http://localhost:8080/v1",
  llm_model    = "my-model"
)

# Pass an ellmer Chat object directly
tardoc::document_targets(llm = TRUE, llm_chat = ellmer::chat_groq())
Requires ellmer. Calls are made only for
targets where description = "" and for every function page, and the results are
written back into the .md files inside the generated block — so they are
reviewable in a diff, and editable.
9 On large pipelines
Checked against a synthetic pipeline of 420 targets and 120 functions.
A flat sidebar does not survive that: it was 420 rows and 12,600px of scroll, of which a 900px viewport showed 7%. The default list is grouped by status and capped at 40 — errored and outdated targets are never truncated, because they are the reason you opened the page, while the healthy majority is summarised as Showing 40 of 420 · show all. Functions group by the file that defines them.
The default view answers “what needs attention” rather than listing everything alphabetically. Navigating to something the cap hides pins it at the top under Current, so the sidebar always shows where you are. Search reaches the rest.
9.1 Grouping the graph
420 nodes in a layered layout is a line nobody can read. When tardoc can find a grouping worth offering, the overview gets a group toggle that collapses it to one node per group; clicking a group drills into it, and back to groups returns. The flat graph stays the default — grouping is an option, not a rewrite of the view.
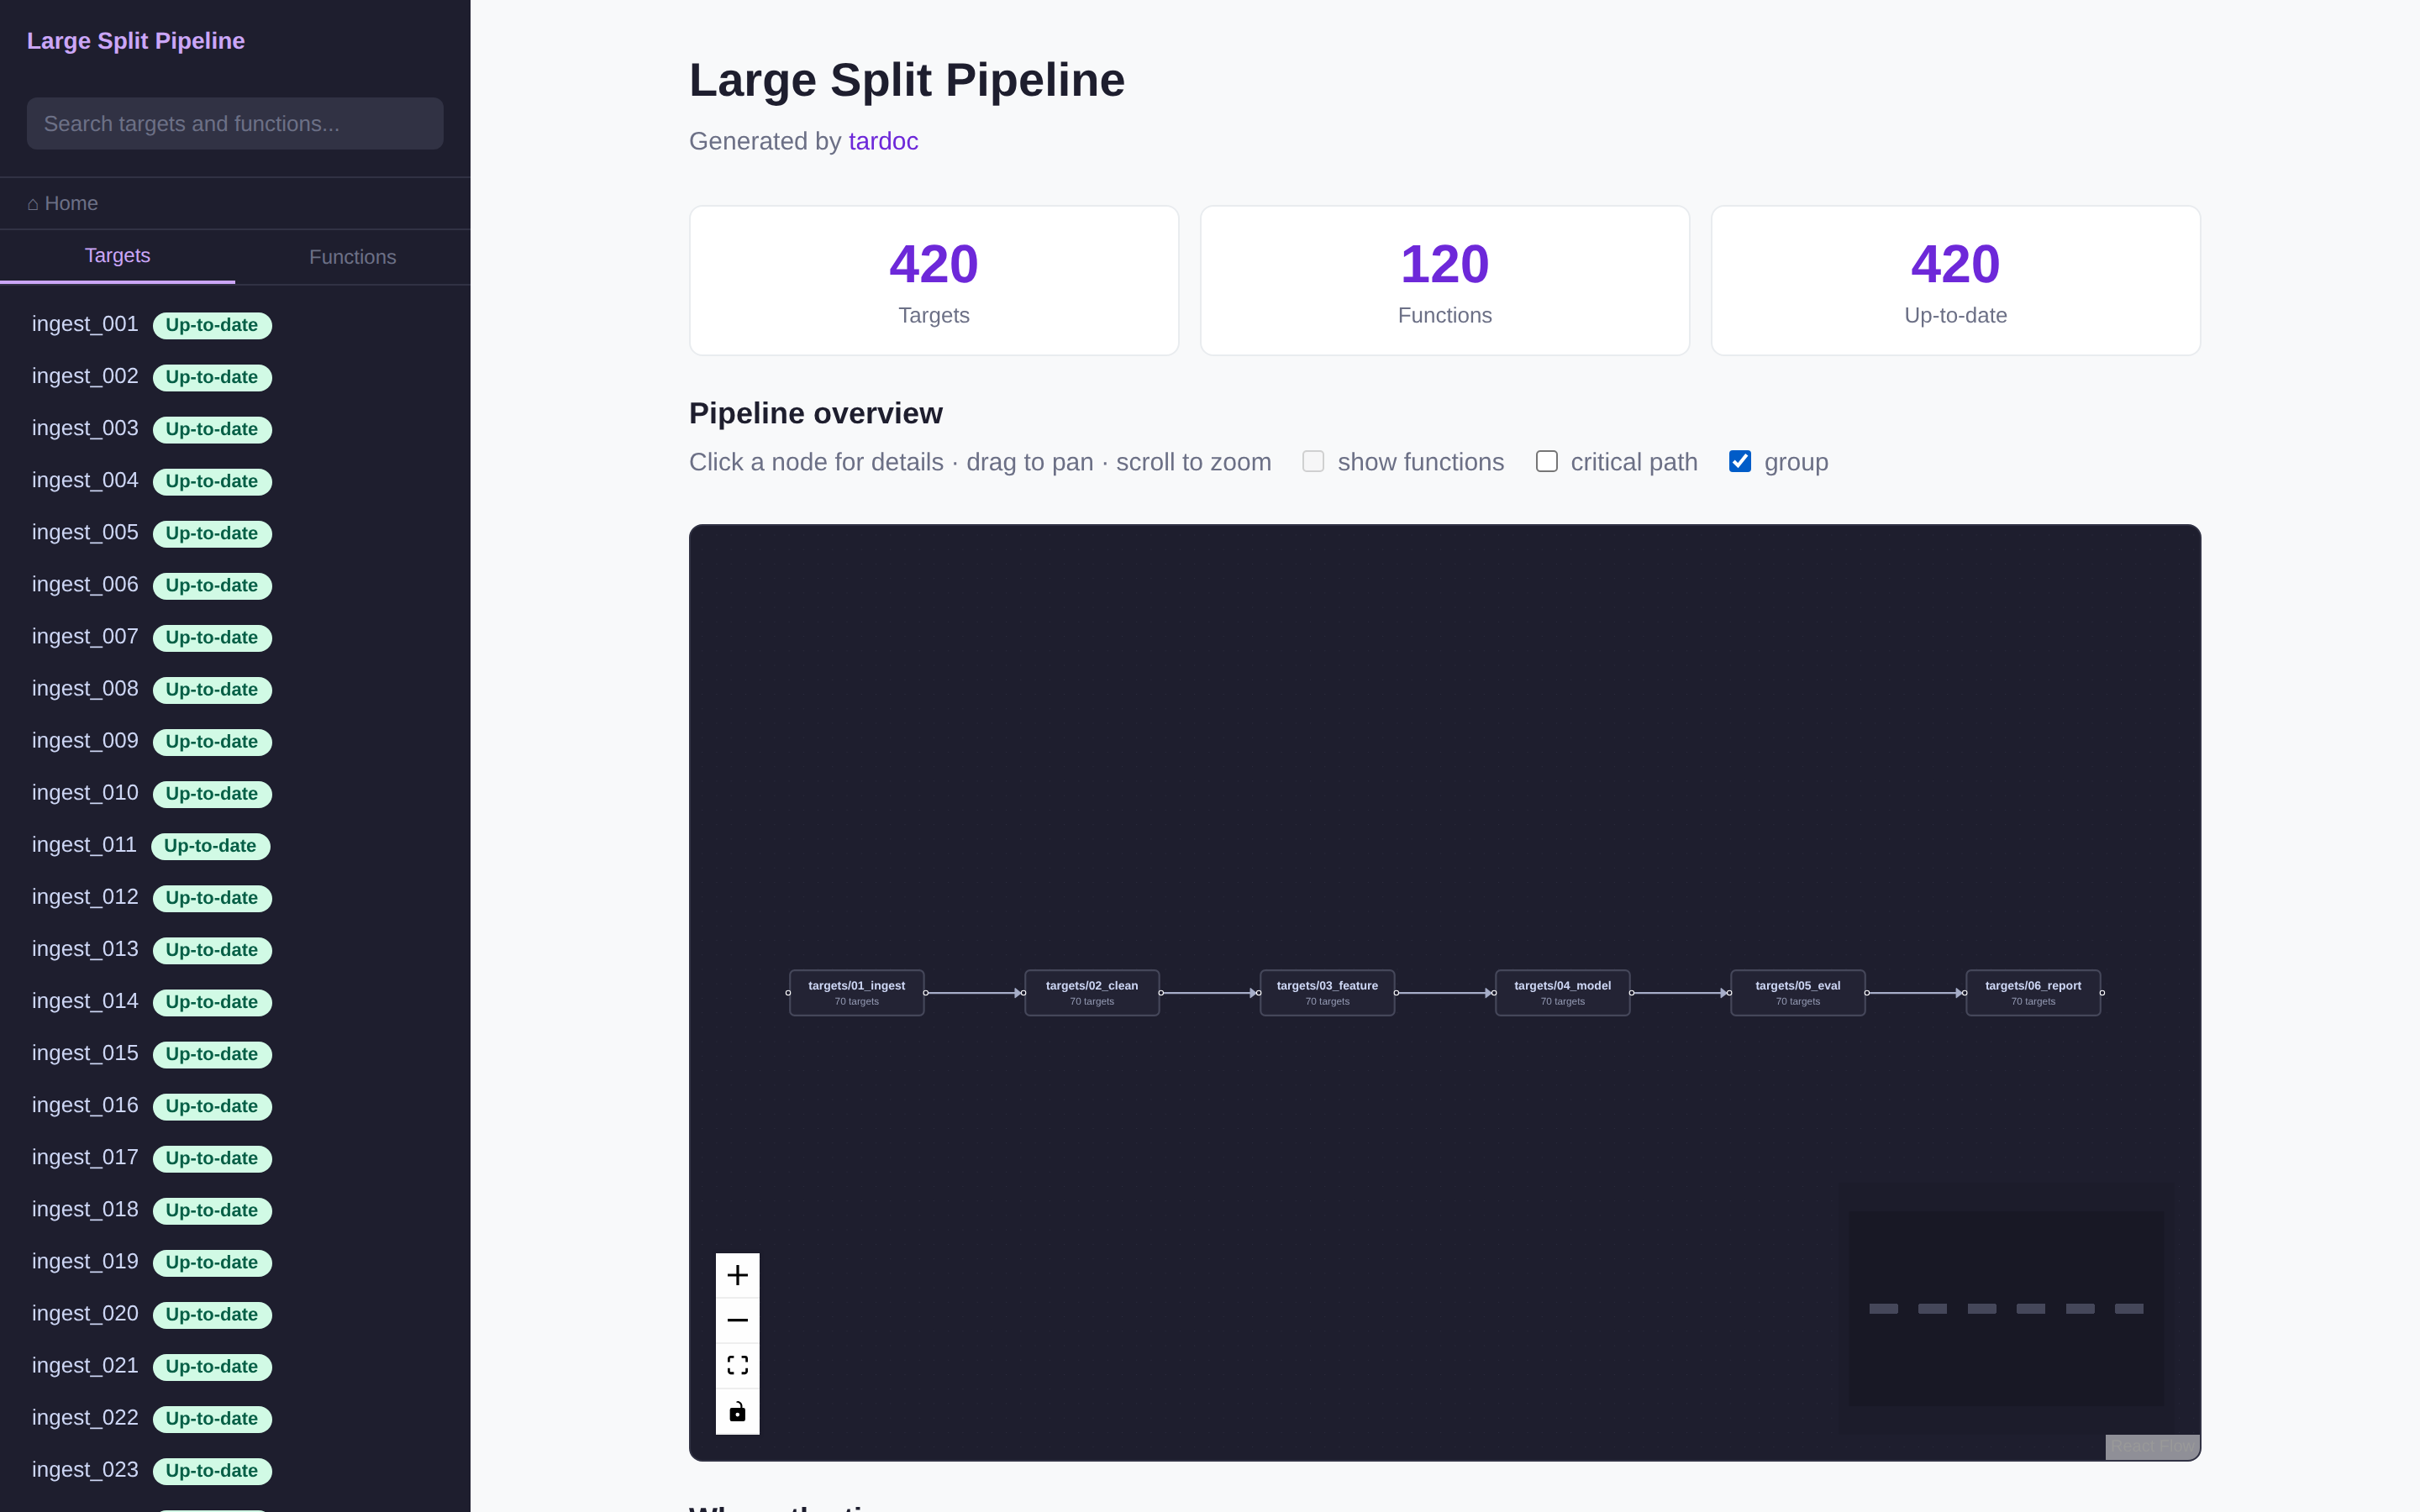
The groups are found rather than configured. target_groups() tries four signals
in descending order of authority and takes the first that clears a quality bar:
| Signal | What it uses |
|---|---|
declaration |
The file each target is declared in — parsed from _targets.R and everything it sources. A project split into targets/ingest.R, targets/model.R has already declared its grouping |
functions |
The source file of the functions a target calls |
prefix |
A shared name prefix: ingest_01, ingest_02 → ingest |
depth |
Bands of dependency depth. A last resort |
A grouping only counts if it has 2–20 groups, averages at least three members
each, and has no group holding more than 70% of the pipeline — so a bad grouping
is rejected rather than shown. Below 15 targets auto does not group at all:
seven targets read fine as a list.
Authority beats arithmetic. On a long chain, depth bands score better than a name prefix — six tidy bands against three uneven groups — but they are the worse reading of the pipeline. Taking the first signal past the bar rather than the highest-scoring one is what keeps the precedence meaningful. There is a test pinning exactly that.
Force or disable it with document_targets(group_by = "declaration"),
"prefix", "none" and so on. A named method is honoured even when it falls
short of the bar; only "auto" is fussy.
9.2 Still open
The viewer is a single self-contained file — 1.1 MB for the 420-target pipeline —
and it grows with the number of pages. Roughly a third of that is the graph
payload, much of which duplicates the search index, so slimming it is the next
move. Splitting pages into separately fetched files would scale further but costs
file:// support, which is worth more.